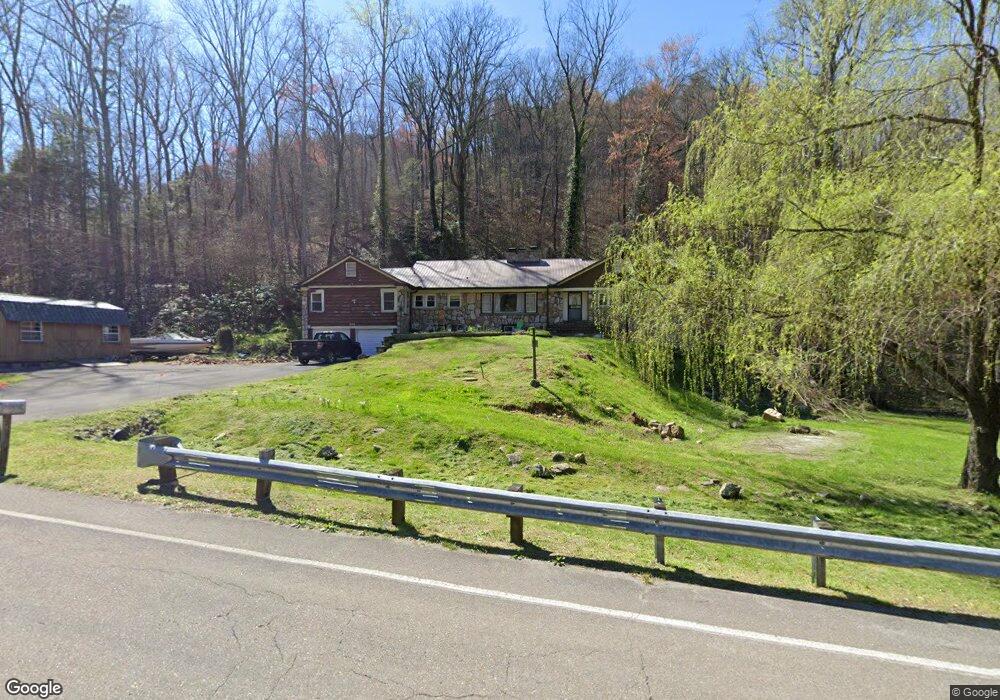
705 Carson Springs Rd Newport, TN 37821
Estimated Value: $269,000 - $500,000
--
Bed
4
Baths
2,772
Sq Ft
$136/Sq Ft
Est. Value
About This Home
This home is located at 705 Carson Springs Rd, Newport, TN 37821 and is currently estimated at $378,018, approximately $136 per square foot. 705 Carson Springs Rd is a home located in Cocke County with nearby schools including Edgemont Elementary School and Cocke County High School.
Ownership History
Date
Name
Owned For
Owner Type
Purchase Details
Closed on
Apr 17, 2012
Sold by
Bank Of America Na
Bought by
Sharpe Asa B and Sharpe Cherie J
Current Estimated Value
Purchase Details
Closed on
Jul 20, 2011
Sold by
Schmitt Duane E
Bought by
Bank Of America Na
Purchase Details
Closed on
Mar 4, 2005
Sold by
Bull Michael J
Bought by
Schmitt Duane E
Home Financials for this Owner
Home Financials are based on the most recent Mortgage that was taken out on this home.
Original Mortgage
$120,800
Interest Rate
6.99%
Mortgage Type
Cash
Purchase Details
Closed on
Mar 28, 2002
Sold by
Bull Michael J and Bull Stephanie
Bought by
Cocke County Tn
Purchase Details
Closed on
Mar 21, 2002
Bought by
Bull Michael J and Bull Stephanie
Purchase Details
Closed on
Jun 7, 1996
Sold by
Mcclung James Robert
Bought by
Bull Michael
Create a Home Valuation Report for This Property
The Home Valuation Report is an in-depth analysis detailing your home's value as well as a comparison with similar homes in the area
Home Values in the Area
Average Home Value in this Area
Purchase History
| Date | Buyer | Sale Price | Title Company |
|---|---|---|---|
| Sharpe Asa B | $83,900 | -- | |
| Bank Of America Na | $131,400 | -- | |
| Schmitt Duane E | $151,000 | -- | |
| Cocke County Tn | $23,350 | -- | |
| Bull Michael J | $23,400 | -- | |
| Bull Michael | $103,000 | -- |
Source: Public Records
Mortgage History
| Date | Status | Borrower | Loan Amount |
|---|---|---|---|
| Previous Owner | Bull Michael | $120,800 |
Source: Public Records
Tax History Compared to Growth
Tax History
| Year | Tax Paid | Tax Assessment Tax Assessment Total Assessment is a certain percentage of the fair market value that is determined by local assessors to be the total taxable value of land and additions on the property. | Land | Improvement |
|---|---|---|---|---|
| 2024 | $1,523 | $59,500 | $7,925 | $51,575 |
| 2023 | $1,523 | $59,500 | $7,925 | $51,575 |
| 2022 | $1,526 | $59,500 | $7,925 | $51,575 |
| 2021 | $1,526 | $59,500 | $7,925 | $51,575 |
| 2020 | $1,526 | $59,500 | $7,925 | $51,575 |
| 2019 | $1,342 | $47,425 | $5,250 | $42,175 |
| 2018 | $1,342 | $47,425 | $5,250 | $42,175 |
| 2017 | $1,375 | $47,425 | $5,250 | $42,175 |
| 2016 | $1,227 | $47,425 | $5,250 | $42,175 |
| 2015 | $1,180 | $47,425 | $5,250 | $42,175 |
| 2014 | $1,180 | $47,425 | $5,250 | $42,175 |
| 2013 | $1,180 | $49,175 | $6,375 | $42,800 |
Source: Public Records
Map
Nearby Homes
- 700 Carson Springs Rd
- Lot #12 Bluets Rd
- 721 Carson Springs Rd
- 685 Carson Springs Rd
- 730 Carson Springs Rd
- 1784 Bullard Dr
- 736 Carson Springs Rd
- 744 Carson Springs Rd
- 1775 Bullard Dr
- 671 Carson Springs Rd
- 752 Carson Springs Rd
- 1764 Bullard Dr
- 1760 Bullard Dr
- 661 Carson Springs Rd
- 1755 Bullard Dr
- 1751 Bullard Dr
- 1748 Bullard Dr
- 1243 Applewood Rd
- 1224 Applewood Way
- 647 Carson Springs Rd