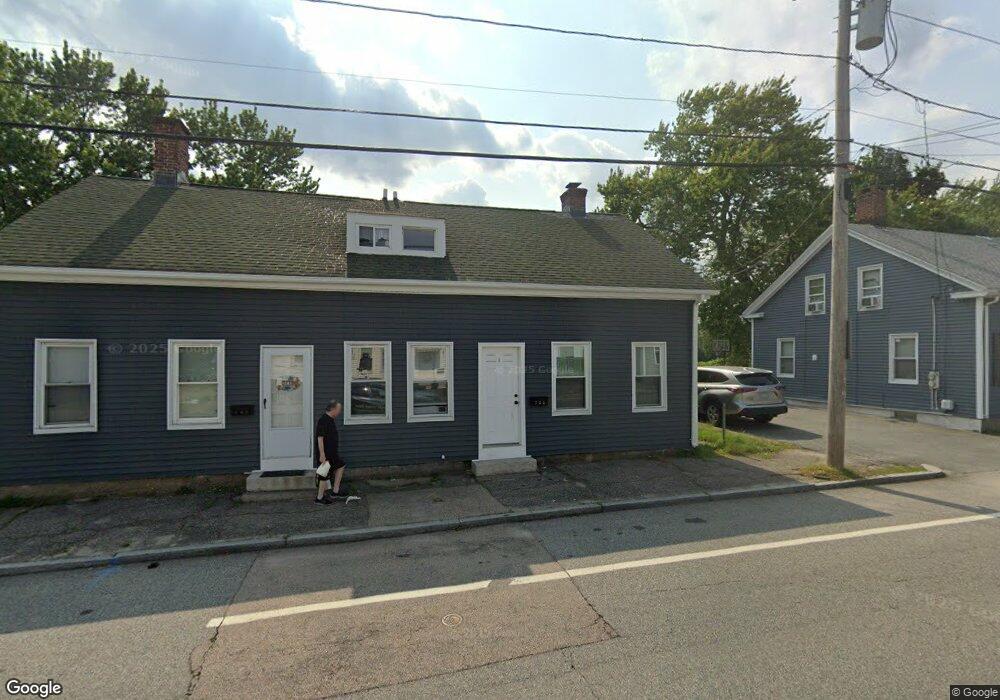
705 Dyer Ave Unit 707 Cranston, RI 02920
Village NeighborhoodEstimated Value: $380,000 - $435,087
6
Beds
2
Baths
2,200
Sq Ft
$188/Sq Ft
Est. Value
About This Home
This home is located at 705 Dyer Ave Unit 707, Cranston, RI 02920 and is currently estimated at $414,022, approximately $188 per square foot. 705 Dyer Ave Unit 707 is a home located in Providence County with nearby schools including Arlington Elementary School, Hugh B. Bain Middle School, and Cranston High School East.
Ownership History
Date
Name
Owned For
Owner Type
Purchase Details
Closed on
Sep 28, 2020
Sold by
Boudreau John H
Bought by
Boudreau John H and Boudreau Jodi A
Current Estimated Value
Purchase Details
Closed on
Jul 2, 1996
Sold by
Silva Arthur A and Silva Ellen
Bought by
Boudreau John H and Boudreau Jodi
Home Financials for this Owner
Home Financials are based on the most recent Mortgage that was taken out on this home.
Original Mortgage
$70,550
Interest Rate
8.05%
Create a Home Valuation Report for This Property
The Home Valuation Report is an in-depth analysis detailing your home's value as well as a comparison with similar homes in the area
Home Values in the Area
Average Home Value in this Area
Purchase History
| Date | Buyer | Sale Price | Title Company |
|---|---|---|---|
| Boudreau John H | -- | None Available | |
| Boudreau John H | $83,000 | -- |
Source: Public Records
Mortgage History
| Date | Status | Borrower | Loan Amount |
|---|---|---|---|
| Previous Owner | Boudreau John H | $171,000 | |
| Previous Owner | Boudreau John H | $97,600 | |
| Previous Owner | Boudreau John H | $70,550 |
Source: Public Records
Tax History Compared to Growth
Tax History
| Year | Tax Paid | Tax Assessment Tax Assessment Total Assessment is a certain percentage of the fair market value that is determined by local assessors to be the total taxable value of land and additions on the property. | Land | Improvement |
|---|---|---|---|---|
| 2025 | $4,453 | $320,800 | $109,400 | $211,400 |
| 2024 | $4,309 | $316,600 | $109,400 | $207,200 |
| 2023 | $3,956 | $209,300 | $48,000 | $161,300 |
| 2022 | $3,874 | $209,300 | $48,000 | $161,300 |
| 2021 | $3,767 | $209,300 | $48,000 | $161,300 |
| 2020 | $3,460 | $166,600 | $37,700 | $128,900 |
| 2019 | $3,460 | $166,600 | $37,700 | $128,900 |
| 2018 | $3,380 | $166,600 | $37,700 | $128,900 |
| 2017 | $2,218 | $96,700 | $17,200 | $79,500 |
| 2016 | $2,171 | $96,700 | $17,200 | $79,500 |
| 2015 | $2,171 | $96,700 | $17,200 | $79,500 |
| 2014 | $2,369 | $103,700 | $17,200 | $86,500 |
Source: Public Records
Map
Nearby Homes
- 761 Dyer Ave
- 1303 Cranston St
- 24-26 Pendleton St
- 18 Standish Ave
- 92 Old Oak Ave
- 7 Cleveland Ave
- 9 Southern St
- 0 Princess Ave
- 2 Gansett Ave
- 1250 Cranston St
- 70 Florida Ave
- 140 Lawrence St Unit 142
- 0 Doane St
- 1574 Cranston St
- 318 Princess Ave
- 95 Elwyn St
- 174 Gansett Ave
- 18 Doane St
- 14 New Hampshire St
- 443 Dyer Ave