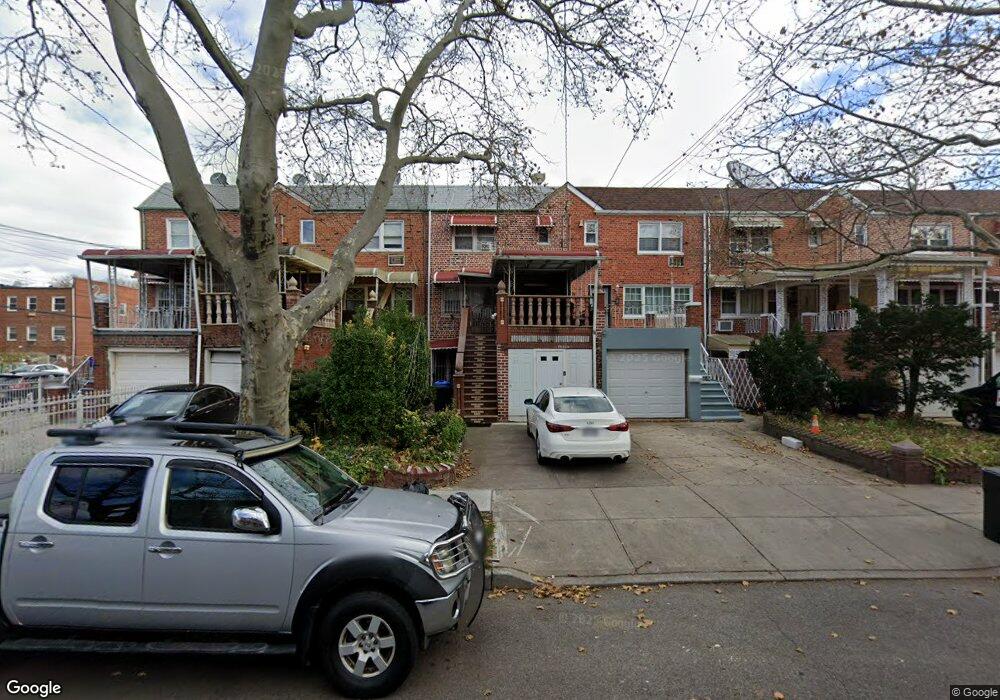
705 E 79th St Brooklyn, NY 11236
Canarsie NeighborhoodEstimated Value: $699,000 - $941,000
Studio
--
Bath
2,223
Sq Ft
$386/Sq Ft
Est. Value
About This Home
This home is located at 705 E 79th St, Brooklyn, NY 11236 and is currently estimated at $858,399, approximately $386 per square foot. 705 E 79th St is a home located in Kings County with nearby schools including P.S. 276 Louis Marshall, Is 68 Isaac Bildersee, and Explore Excel Charter School.
Ownership History
Date
Name
Owned For
Owner Type
Purchase Details
Closed on
Jun 14, 2010
Sold by
Louigarde Frank and Louigarde Frice
Bought by
Louigarde Esther and Louigarde Frank
Current Estimated Value
Purchase Details
Closed on
Mar 19, 2010
Sold by
Louigarde Frice and Louigarde Ghislaine
Bought by
Louigarde Frank and Louigarde Frice
Home Financials for this Owner
Home Financials are based on the most recent Mortgage that was taken out on this home.
Original Mortgage
$203,000
Interest Rate
4.94%
Mortgage Type
Purchase Money Mortgage
Purchase Details
Closed on
Jan 5, 2004
Sold by
Louigarde Ghislaine and Louigarde Jean Fritz
Bought by
Louigarde Frice and Louigarde Ghislaine
Home Financials for this Owner
Home Financials are based on the most recent Mortgage that was taken out on this home.
Original Mortgage
$29,534
Interest Rate
5.56%
Mortgage Type
Purchase Money Mortgage
Create a Home Valuation Report for This Property
The Home Valuation Report is an in-depth analysis detailing your home's value as well as a comparison with similar homes in the area
Home Values in the Area
Average Home Value in this Area
Purchase History
| Date | Buyer | Sale Price | Title Company |
|---|---|---|---|
| Louigarde Esther | -- | -- | |
| Louigarde Esther | -- | -- | |
| Louigarde Frank | -- | -- | |
| Louigarde Frank | -- | -- | |
| Louigarde Frice | -- | -- | |
| Louigarde Frice | -- | -- |
Source: Public Records
Mortgage History
| Date | Status | Borrower | Loan Amount |
|---|---|---|---|
| Previous Owner | Louigarde Frank | $203,000 | |
| Previous Owner | Louigarde Frice | $29,534 |
Source: Public Records
Tax History
| Year | Tax Paid | Tax Assessment Tax Assessment Total Assessment is a certain percentage of the fair market value that is determined by local assessors to be the total taxable value of land and additions on the property. | Land | Improvement |
|---|---|---|---|---|
| 2025 | $8,330 | $60,120 | $10,740 | $49,380 |
| 2024 | $8,330 | $51,360 | $10,740 | $40,620 |
| 2023 | $7,998 | $54,900 | $10,740 | $44,160 |
| 2022 | $7,417 | $50,760 | $10,740 | $40,020 |
| 2021 | $7,440 | $44,940 | $10,740 | $34,200 |
| 2020 | $7,483 | $38,580 | $10,740 | $27,840 |
| 2019 | $7,230 | $38,580 | $10,740 | $27,840 |
Source: Public Records
Map
Nearby Homes
Your Personal Tour Guide
Ask me questions while you tour the home.