Estimated Value: $143,000 - $178,000
3
Beds
3
Baths
1,296
Sq Ft
$123/Sq Ft
Est. Value
About This Home
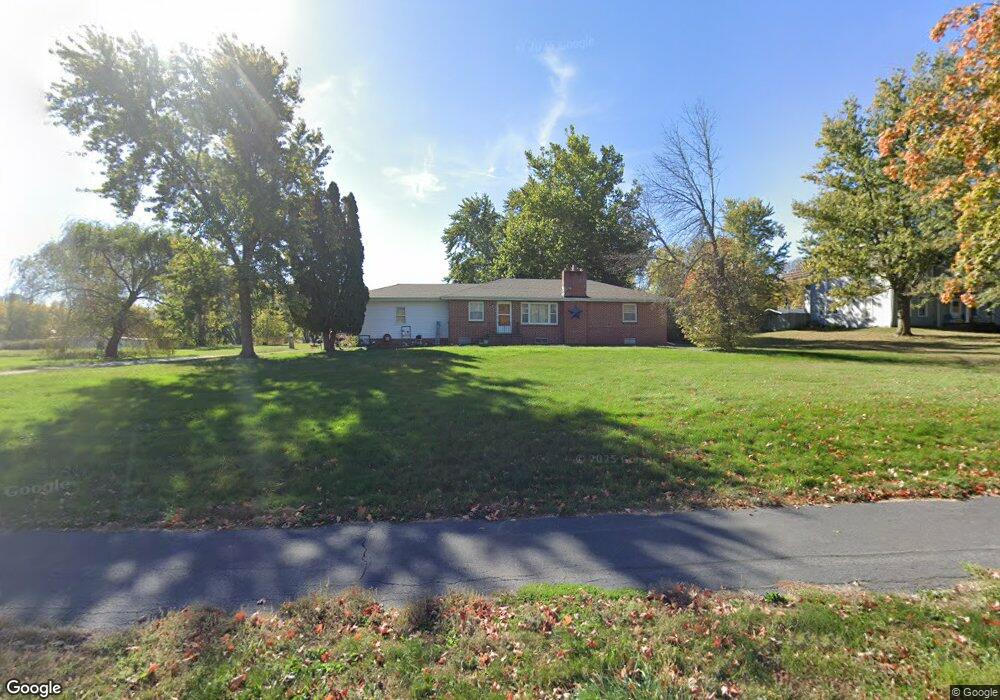
This home is located at 705 E Filmore St, Afton, IA 50830 and is currently estimated at $159,103, approximately $122 per square foot. 705 E Filmore St is a home with nearby schools including East Union Middle/High School.
Ownership History
Date
Name
Owned For
Owner Type
Purchase Details
Closed on
Jul 17, 2019
Sold by
Grettenberg Kathleen and Grettenberg John
Bought by
Torgerson Staci J and Torgerson Joseph N
Current Estimated Value
Home Financials for this Owner
Home Financials are based on the most recent Mortgage that was taken out on this home.
Original Mortgage
$84,848
Outstanding Balance
$74,334
Interest Rate
3.82%
Mortgage Type
New Conventional
Estimated Equity
$84,769
Purchase Details
Closed on
Jun 5, 2006
Sold by
Briley Chad A and Briley Treana R
Bought by
Kilgore Rudy G and Kilgore Linda M
Create a Home Valuation Report for This Property
The Home Valuation Report is an in-depth analysis detailing your home's value as well as a comparison with similar homes in the area
Purchase History
| Date | Buyer | Sale Price | Title Company |
|---|---|---|---|
| Torgerson Staci J | -- | -- | |
| Kilgore Rudy G | $22,000 | None Available |
Source: Public Records
Mortgage History
| Date | Status | Borrower | Loan Amount |
|---|---|---|---|
| Open | Torgerson Staci J | $84,848 |
Source: Public Records
Tax History
| Year | Tax Paid | Tax Assessment Tax Assessment Total Assessment is a certain percentage of the fair market value that is determined by local assessors to be the total taxable value of land and additions on the property. | Land | Improvement |
|---|---|---|---|---|
| 2025 | $2,296 | $142,370 | $20,260 | $122,110 |
| 2024 | $2,296 | $128,610 | $20,260 | $108,350 |
| 2023 | $2,512 | $129,410 | $19,620 | $109,790 |
| 2022 | $2,492 | $120,600 | $19,620 | $100,980 |
| 2021 | $2,492 | $113,490 | $19,120 | $94,370 |
| 2020 | $2,486 | $105,360 | $11,490 | $93,870 |
| 2019 | $2,540 | $105,360 | $0 | $0 |
| 2018 | $2,428 | $105,360 | $0 | $0 |
| 2017 | $2,528 | $105,360 | $0 | $0 |
| 2016 | $2,464 | $105,360 | $0 | $0 |
| 2015 | $2,464 | $96,660 | $0 | $0 |
| 2014 | $2,290 | $96,660 | $0 | $0 |
Source: Public Records
Map
Nearby Homes
- 508 E Filmore St
- 108 W Filmore St
- 2374 Us Hwy 34 None
- 2374 Us Hwy 34
- 2223 180th St
- 0000 Nighthawk Ave
- Nighthawk Ave
- 501 N Mulberry St
- 405 S Vine St
- 208 N Cherry St
- 615 N Poplar St
- 305 S Birch St
- 605 N Cherry St
- 1207 N Mulberry St
- 307 N Birch St
- 702 N Cherry St
- 304 N Birch St
- 310 N Walnut St
- 707 N Birch St
- 606 S Elm St
- 701 E Filmore St
- 700 E Filmore St
- 804 E Filmore St
- 615 E Filmore St
- 616 E Filmore St
- 805 E Filmore St
- 612 E Filmore St
- 607 E Filmore St
- 805 E Polk St Unit 7
- 608 E Filmore St
- 109 N Temple St
- 112 N Temple St
- 704 E Scott St
- 604 E Filmore St
- 601 E Filmore St
- 201 N Temple St
- 600 E Filmore St
- 607 E Kansas St
- 210 S Grace St
- 210 S Grace St Unit 3
Your Personal Tour Guide
Ask me questions while you tour the home.