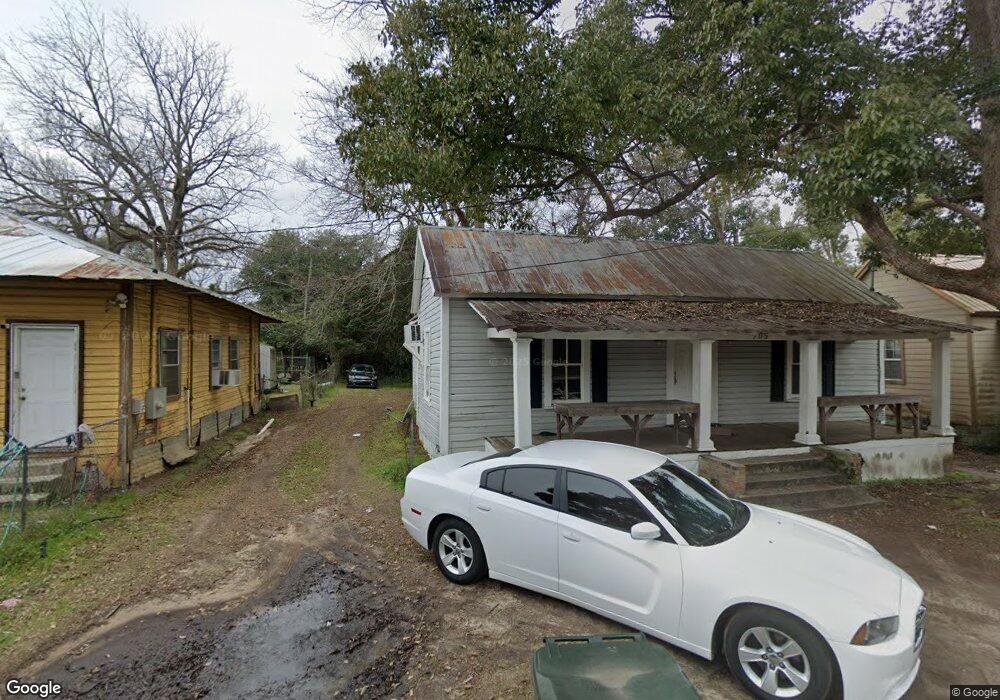
705 Foundry St Bainbridge, GA 39817
Estimated Value: $46,521 - $163,000
--
Bed
1
Bath
760
Sq Ft
$126/Sq Ft
Est. Value
About This Home
This home is located at 705 Foundry St, Bainbridge, GA 39817 and is currently estimated at $95,380, approximately $125 per square foot. 705 Foundry St is a home located in Decatur County with nearby schools including Bainbridge High School and Grace Christian Academy.
Create a Home Valuation Report for This Property
The Home Valuation Report is an in-depth analysis detailing your home's value as well as a comparison with similar homes in the area
Home Values in the Area
Average Home Value in this Area
Tax History Compared to Growth
Tax History
| Year | Tax Paid | Tax Assessment Tax Assessment Total Assessment is a certain percentage of the fair market value that is determined by local assessors to be the total taxable value of land and additions on the property. | Land | Improvement |
|---|---|---|---|---|
| 2024 | $281 | $8,879 | $709 | $8,170 |
| 2023 | $280 | $8,879 | $709 | $8,170 |
| 2022 | $274 | $8,879 | $709 | $8,170 |
| 2021 | $249 | $7,868 | $709 | $7,159 |
| 2020 | $224 | $6,698 | $709 | $5,989 |
| 2019 | $223 | $6,409 | $709 | $5,700 |
| 2018 | $220 | $6,409 | $709 | $5,700 |
| 2017 | $205 | $5,875 | $688 | $5,187 |
| 2016 | $205 | $5,875 | $688 | $5,187 |
| 2015 | $211 | $5,875 | $688 | $5,187 |
| 2014 | $196 | $5,875 | $688 | $5,187 |
| 2013 | -- | $5,875 | $688 | $5,187 |
Source: Public Records
Map
Nearby Homes
- 836 Cooper St
- 411 Independent St
- 502 Planter St
- 435 E Broughton St
- 302 E Water St
- 418 E Broughton St
- 927 5th Ave
- Dell Rd
- 423 E Shotwell St
- 640 E Shotwell St
- 632 E Shotwell St
- 320 S Monroe St
- 249 Meredith Dr
- 245 Meredith Dr
- Lot 3 Mountain View Way
- 0000 Mountain View Way
- Lot 8 Mountain View Way
- 1020 E Water St
- 306 S Broad St
- 632 E Evans St