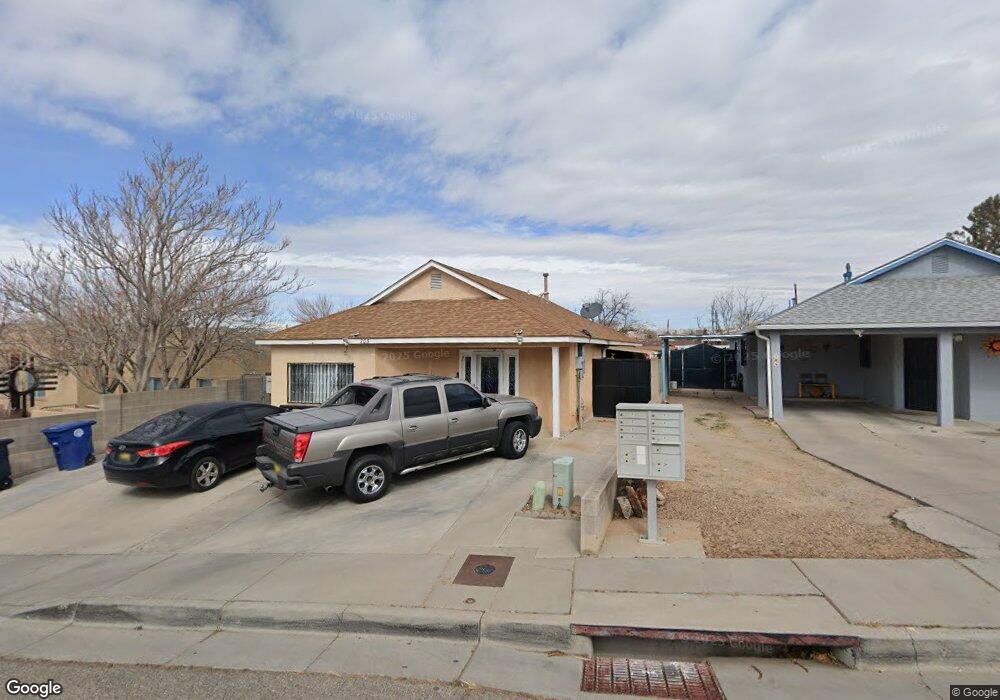
705 Kinley Ave NE Albuquerque, NM 87102
Wells Park NeighborhoodEstimated Value: $264,000 - $327,000
4
Beds
2
Baths
1,680
Sq Ft
$172/Sq Ft
Est. Value
About This Home
This home is located at 705 Kinley Ave NE, Albuquerque, NM 87102 and is currently estimated at $288,277, approximately $171 per square foot. 705 Kinley Ave NE is a home located in Bernalillo County with nearby schools including Longfellow Elementary School, Jefferson Middle School, and Albuquerque High School.
Create a Home Valuation Report for This Property
The Home Valuation Report is an in-depth analysis detailing your home's value as well as a comparison with similar homes in the area
Home Values in the Area
Average Home Value in this Area
Tax History Compared to Growth
Tax History
| Year | Tax Paid | Tax Assessment Tax Assessment Total Assessment is a certain percentage of the fair market value that is determined by local assessors to be the total taxable value of land and additions on the property. | Land | Improvement |
|---|---|---|---|---|
| 2025 | $1,535 | $39,528 | $9,740 | $29,788 |
| 2024 | $1,535 | $38,376 | $9,456 | $28,920 |
| 2023 | $1,507 | $37,259 | $9,181 | $28,078 |
| 2022 | $1,454 | $36,175 | $8,914 | $27,261 |
| 2021 | $1,402 | $35,121 | $8,654 | $26,467 |
| 2020 | $1,377 | $34,098 | $8,402 | $25,696 |
| 2019 | $1,334 | $33,106 | $8,158 | $24,948 |
| 2018 | $1,284 | $33,106 | $8,158 | $24,948 |
| 2017 | $1,242 | $32,142 | $7,921 | $24,221 |
| 2016 | $1,204 | $30,297 | $7,466 | $22,831 |
| 2015 | $43,790 | $43,790 | $5,565 | $38,225 |
| 2014 | $1,720 | $42,514 | $5,403 | $37,111 |
| 2013 | -- | $41,276 | $5,246 | $36,030 |
Source: Public Records
Map
Nearby Homes
- 715 Kinley Ave NE
- 0 Edith Blvd NE Unit 1081827
- 1116 Edith Blvd NE
- 1011a Edith Blvd NE
- 1011 Edith Blvd NE Unit A-D
- 500 Mountain Rd NE
- 518 Marble St NE
- 916 Franciscan St NE
- 906 Franciscan St NE
- 609 Page Ave NE
- 527 Slate Ave NE
- 510 Slate Ave NE
- 806 Arno St NE
- 1916 4th St NW
- 1401 5th St NW
- 2210 Commercial St NE
- 308 Prospect Ave NE
- 510 Mountain Rd NW
- 2403 Broadway Blvd NE
- 1003 6th St NW
- 709 Kinley Ave NE
- 1424 Walter St NE
- 1424 Walter St NE
- 624 Cordero Rd NE
- 624 Cordero Ave NE
- 1422 Walter St NE
- 618 Cordero Rd NE
- 717 Kinley Ave NE
- 620 Cordero Rd NE
- 716 Kinley Ave NE
- 721 Kinley Ave NE
- 720 Kinley Ave NE
- 700 Cordero Rd NE
- 708 Cordero Rd NE
- 14203 Walter St NE
- 617 Cordero Rd NE
- 1406 Edith Blvd NE
- 1406 Edith Blvd NE Unit 1 2
- 1406 Edith Blvd NE Unit A & B
- 1418 Walter St NE