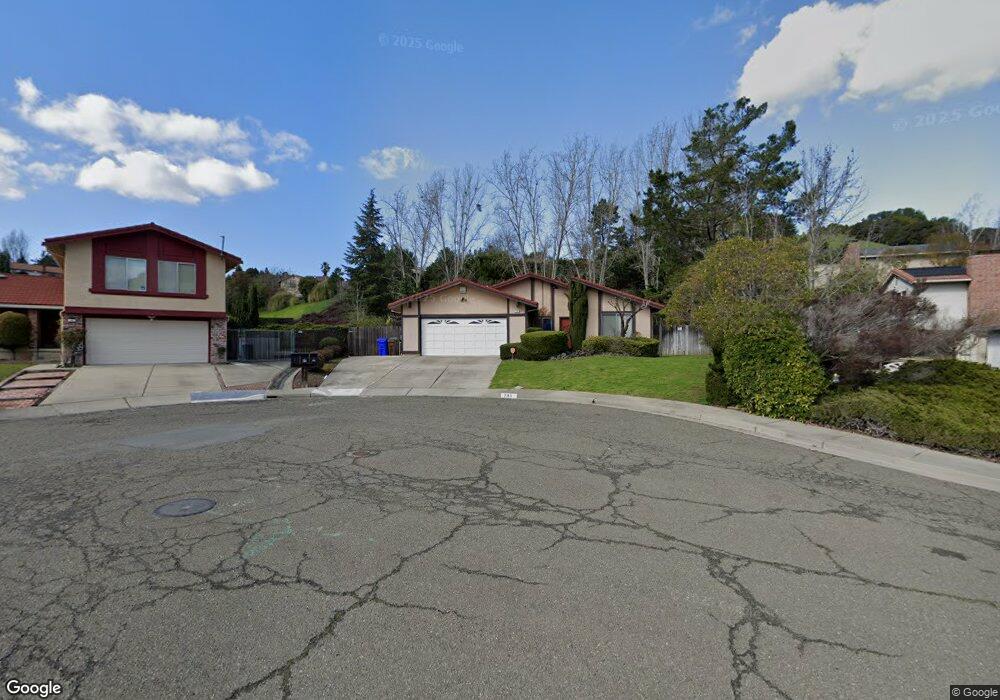
705 Kipling Ct El Sobrante, CA 94803
El Sobrante Hills NeighborhoodEstimated Value: $841,000 - $901,000
4
Beds
2
Baths
1,854
Sq Ft
$471/Sq Ft
Est. Value
About This Home
This home is located at 705 Kipling Ct, El Sobrante, CA 94803 and is currently estimated at $872,803, approximately $470 per square foot. 705 Kipling Ct is a home located in Contra Costa County with nearby schools including Olinda Elementary School, Betty Reid Soskin Middle School, and De Anza Senior High School.
Ownership History
Date
Name
Owned For
Owner Type
Purchase Details
Closed on
Jan 25, 2021
Sold by
Brass Francis and Brass Jennifer
Bought by
Brass Francis and Brass Jennifer
Current Estimated Value
Purchase Details
Closed on
Jun 4, 2002
Sold by
Turner Nancy and Turner James
Bought by
Brass Francis and Brass Jennifer
Home Financials for this Owner
Home Financials are based on the most recent Mortgage that was taken out on this home.
Original Mortgage
$300,700
Outstanding Balance
$126,513
Interest Rate
6.74%
Mortgage Type
Purchase Money Mortgage
Estimated Equity
$746,290
Purchase Details
Closed on
Aug 2, 2001
Sold by
Turner Nancy
Bought by
Turner James and Turner Nancy
Home Financials for this Owner
Home Financials are based on the most recent Mortgage that was taken out on this home.
Original Mortgage
$82,000
Interest Rate
7.1%
Mortgage Type
Credit Line Revolving
Purchase Details
Closed on
Feb 22, 2001
Sold by
Rawlins John T and Rawlins Nancy
Bought by
Turner Nancy
Create a Home Valuation Report for This Property
The Home Valuation Report is an in-depth analysis detailing your home's value as well as a comparison with similar homes in the area
Home Values in the Area
Average Home Value in this Area
Purchase History
| Date | Buyer | Sale Price | Title Company |
|---|---|---|---|
| Brass Francis | -- | None Available | |
| Brass Francis | $439,000 | Chicago Title Co | |
| Turner James | -- | Landsafe Title | |
| Turner Nancy | -- | -- |
Source: Public Records
Mortgage History
| Date | Status | Borrower | Loan Amount |
|---|---|---|---|
| Open | Brass Francis | $300,700 | |
| Previous Owner | Turner James | $82,000 | |
| Closed | Brass Francis | $138,300 |
Source: Public Records
Tax History
| Year | Tax Paid | Tax Assessment Tax Assessment Total Assessment is a certain percentage of the fair market value that is determined by local assessors to be the total taxable value of land and additions on the property. | Land | Improvement |
|---|---|---|---|---|
| 2025 | $10,380 | $648,516 | $349,373 | $299,143 |
| 2024 | $9,931 | $635,801 | $342,523 | $293,278 |
| 2023 | $9,931 | $623,335 | $335,807 | $287,528 |
| 2022 | $9,792 | $611,114 | $329,223 | $281,891 |
| 2021 | $9,744 | $599,132 | $322,768 | $276,364 |
| 2019 | $9,212 | $581,364 | $313,196 | $268,168 |
| 2018 | $8,880 | $569,965 | $307,055 | $262,910 |
| 2017 | $8,681 | $558,790 | $301,035 | $257,755 |
| 2016 | $8,583 | $547,834 | $295,133 | $252,701 |
| 2015 | $8,558 | $539,606 | $290,700 | $248,906 |
| 2014 | $8,458 | $529,037 | $285,006 | $244,031 |
Source: Public Records
Map
Nearby Homes
- 5909 Amend Rd
- 5880 Olinda Rd
- 70 Tavaszi Terrace
- 7 Abbie Ln
- 0 Knobcone Unit ML82036804
- 0 Knobcone Unit 41077144
- 2537 Heide Ct
- 6201 Hillside Dr
- 641 Lois Ln
- 00 Knobcone Dr
- 2563 Patra Dr
- 204 N Rancho
- 15 Abbie Ln
- 5129 Heavenly Ridge Ln
- 5290 San Pablo Dam Rd Unit 18
- 5490 Lenora Rd
- 5470 Lenora Rd
- 208 Valley View Place
- 205 Del Valle Cir
- 3505 Morningside Dr
- 701 Kipling Ct
- 5918 Kipling Dr
- 5922 Kipling Dr
- 708 Garrison Rd
- 5914 Kipling Dr
- 704 Garrison Rd
- 5905 Amend Rd
- 5906 Kipling Dr
- 700 Kipling Ct
- 700 Garrison Rd
- 5900 Kipling Dr
- 5913 Amend Rd
- 5926 Kipling Dr
- 801 Maison Way
- 5917 Kipling Dr
- 5919 Amend Rd
- 5934 Kipling Dr
- 5821 Amend Rd
- 5913 Kipling Dr
- 5822 Kipling Dr
Your Personal Tour Guide
Ask me questions while you tour the home.