705 N Main St Randolph, MA 02368
North Randolph NeighborhoodEstimated Value: $606,469 - $923,000
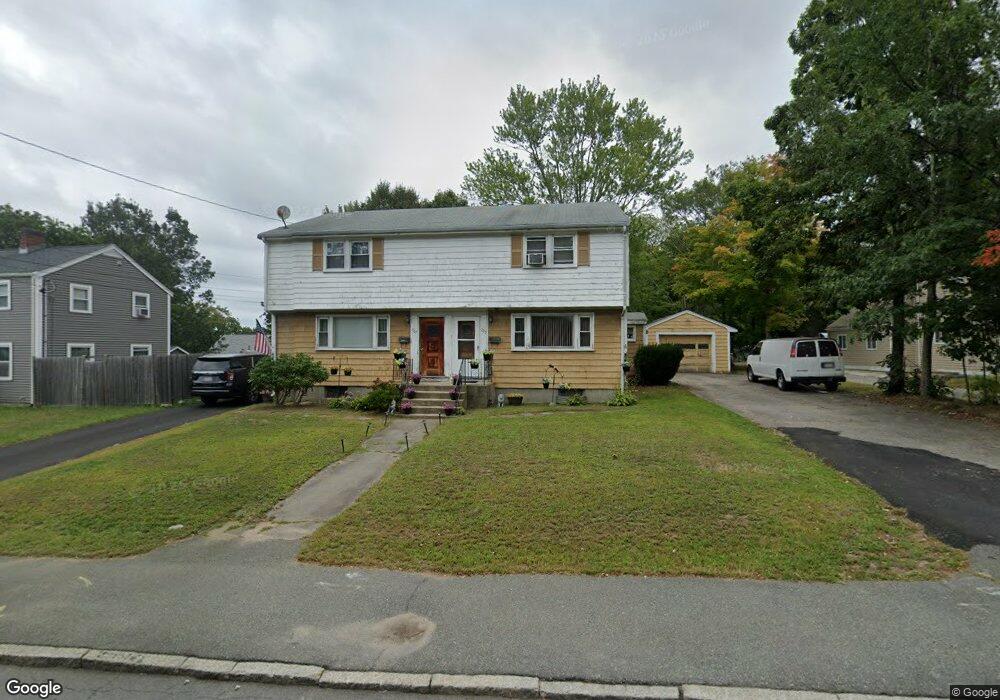
About This Home
This home is located at 705 N Main St, Randolph, MA 02368 and is currently estimated at $782,867, approximately $301 per square foot. 705 N Main St is a home located in Norfolk County with nearby schools including Randolph High School, Boston Higashi School, and Lighthouse Baptist Christian Academy.
Ownership History
We collect this data history from publicly available records. To have your information removed, we recommend requesting removal directly through your county’s website.
Purchase Details
Purchase Details
Home Values in the Area
Average Home Value in this Area
Purchase History
We collect this data history from publicly available records. To have your information removed, we recommend requesting removal directly through your county’s website.
| Date | Buyer | Sale Price | Title Company |
|---|---|---|---|
| -- | None Available | ||
| -- | None Available | ||
| -- | -- | ||
| -- | -- |
Tax History
We collect this data history from publicly available records. To have your information removed, we recommend requesting removal directly through your county’s website.
| Year | Tax Paid | Tax Assessment Tax Assessment Total Assessment is a certain percentage of the fair market value that is determined by local assessors to be the total taxable value of land and additions on the property. | Land | Improvement |
|---|---|---|---|---|
| 2025 | $7,933 | $683,300 | $228,100 | $455,200 |
| 2024 | $7,304 | $637,900 | $223,700 | $414,200 |
| 2023 | $6,784 | $561,600 | $203,300 | $358,300 |
| 2022 | $6,468 | $475,600 | $169,400 | $306,200 |
| 2021 | $7,072 | $478,500 | $141,200 | $337,300 |
| 2020 | $6,729 | $451,300 | $141,200 | $310,100 |
| 2019 | $6,340 | $423,200 | $134,500 | $288,700 |
| 2018 | $5,595 | $352,300 | $122,200 | $230,100 |
| 2017 | $5,488 | $339,200 | $116,500 | $222,700 |
| 2016 | $5,045 | $290,100 | $105,900 | $184,200 |
| 2015 | $4,760 | $263,000 | $100,800 | $162,200 |
Map
- 66 Orchard St
- 19 Clark St
- 18 Vesey Rd
- 17 Norroway Ave
- 36 Raechel Rd
- 90 Liberty St
- 60 Pond Ln
- 12 Jasper Ln Unit 12
- 37 Jasper Ln Unit 37
- 52 Jasper Ln
- 93 Cross St
- 181 Oak St
- 1 Royal Crest Dr Unit 3
- 240 Grove St
- 24 Nelson Dr Unit 2D
- 23 Emily Jeffers Rd
- 39 West St Unit A1
- 59 Boylston St
- 304 High St
- 35 Pearl St Unit 35
Ask me questions while you tour the home.