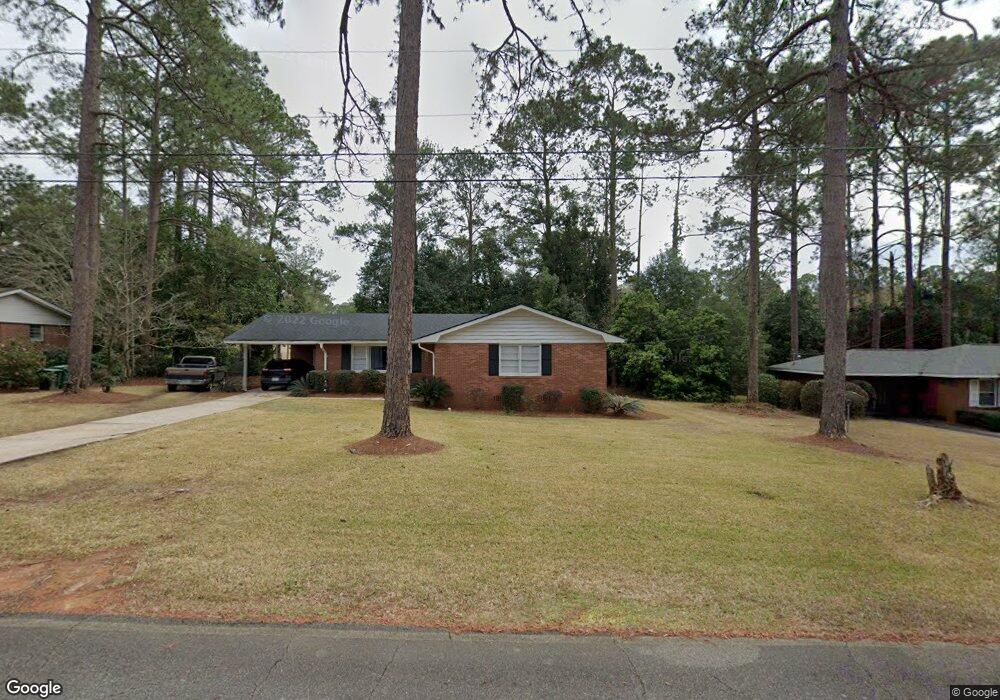
705 Pineridge Dr Valdosta, GA 31602
Estimated Value: $210,000 - $250,000
3
Beds
2
Baths
1,576
Sq Ft
$141/Sq Ft
Est. Value
About This Home
This home is located at 705 Pineridge Dr, Valdosta, GA 31602 and is currently estimated at $222,554, approximately $141 per square foot. 705 Pineridge Dr is a home located in Lowndes County with nearby schools including S.L. Mason Elementary School, Valdosta Middle School, and Valdosta High School.
Ownership History
Date
Name
Owned For
Owner Type
Purchase Details
Closed on
May 24, 2019
Sold by
Doub Jeffrey Scott
Bought by
Doub Landen Scott
Current Estimated Value
Home Financials for this Owner
Home Financials are based on the most recent Mortgage that was taken out on this home.
Original Mortgage
$99,000
Outstanding Balance
$76,068
Interest Rate
4.2%
Mortgage Type
New Conventional
Estimated Equity
$146,486
Purchase Details
Closed on
Apr 20, 2017
Sold by
Cooper Michael O
Bought by
Doub Landen Scott and Doub Jeffrey Scott
Home Financials for this Owner
Home Financials are based on the most recent Mortgage that was taken out on this home.
Original Mortgage
$97,600
Interest Rate
4.21%
Mortgage Type
New Conventional
Purchase Details
Closed on
Oct 6, 2000
Sold by
Morris Virginia K Life
Bought by
Cooper Michael O
Purchase Details
Closed on
Aug 18, 1994
Bought by
Morris Virginia K Life
Purchase Details
Closed on
Apr 22, 1969
Bought by
Morris Virginia K Mrs
Create a Home Valuation Report for This Property
The Home Valuation Report is an in-depth analysis detailing your home's value as well as a comparison with similar homes in the area
Home Values in the Area
Average Home Value in this Area
Purchase History
| Date | Buyer | Sale Price | Title Company |
|---|---|---|---|
| Doub Landen Scott | -- | -- | |
| Doub Landen Scott | $122,000 | -- | |
| Cooper Michael O | $81,900 | -- | |
| Morris Virginia K Life | -- | -- | |
| Morris Virginia K Mrs | $9,900 | -- |
Source: Public Records
Mortgage History
| Date | Status | Borrower | Loan Amount |
|---|---|---|---|
| Open | Doub Landen Scott | $99,000 | |
| Previous Owner | Doub Landen Scott | $97,600 |
Source: Public Records
Tax History Compared to Growth
Tax History
| Year | Tax Paid | Tax Assessment Tax Assessment Total Assessment is a certain percentage of the fair market value that is determined by local assessors to be the total taxable value of land and additions on the property. | Land | Improvement |
|---|---|---|---|---|
| 2024 | $1,834 | $65,676 | $12,848 | $52,828 |
| 2023 | $1,834 | $65,676 | $12,848 | $52,828 |
| 2022 | $1,374 | $40,670 | $12,848 | $27,822 |
| 2021 | $1,414 | $40,670 | $12,848 | $27,822 |
| 2020 | $1,444 | $40,670 | $12,848 | $27,822 |
| 2019 | $1,444 | $40,670 | $12,848 | $27,822 |
| 2018 | $1,463 | $40,670 | $12,848 | $27,822 |
| 2017 | $1,481 | $40,902 | $12,848 | $28,054 |
| 2016 | $1,262 | $40,902 | $12,848 | $28,054 |
| 2015 | $1,158 | $40,902 | $12,848 | $28,054 |
| 2014 | $1,178 | $40,902 | $12,848 | $28,054 |
Source: Public Records
Map
Nearby Homes
- 604 Azalea Cir
- 68 Pineridge Dr
- 2206 White Oak Dr
- 2112 Azalea Dr
- 2325 White Oak Dr
- 2211 Jerry Jones Dr
- 903 Gornto Rd
- 908 Maplewood Dr
- 2217 Brighton Place
- 1 Fox Hollow Cir
- 1104 Linda Dr
- 5 Dellwood Cir
- 1909 Azalea Dr
- 2105 Jerry Jones Dr
- 1108 Kimberly Dr
- 2014 Delvid St
- 805 Millpond Rd
- 814 W Alden Ave
- 2502B Jerry Jones Dr Unit 1
- 817 W Cranford Ave
- 703 Pineridge Dr
- 707 Pineridge Dr
- 12 Loganberry Cir
- 14 Loganberry Cir
- 10 Loganberry Cir
- 704 Pineridge Dr
- 702 Pineridge Dr
- 701 Pineridge Dr
- 702 Pineridge Maplewood Package
- 709 Pineridge Dr
- 8 Loganberry Cir
- 16 Loganberry Cir
- 700 Pineridge Dr
- 28 Loganberry Cir
- 705 Maplewood Dr
- 703 Maplewood Dr
- 13 Loganberry Cir
- 11 Loganberry Cir
- 15 Loganberry Cir
- 9 Loganberry Cir