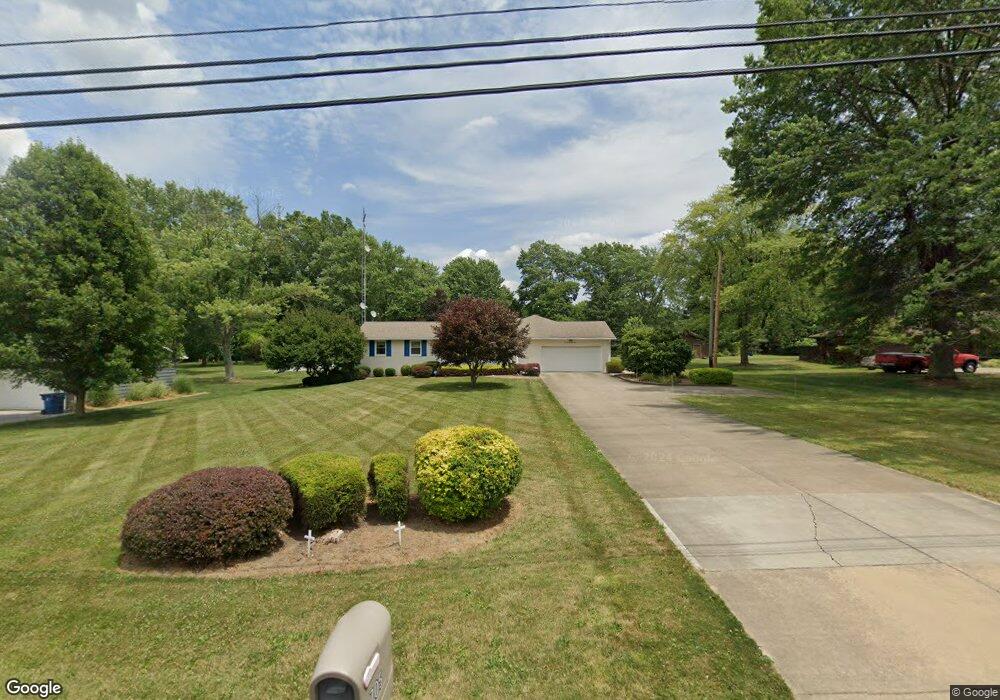
705 S 15th St Sebring, OH 44672
Estimated Value: $261,000 - $319,000
5
Beds
3
Baths
2,100
Sq Ft
$137/Sq Ft
Est. Value
About This Home
This home is located at 705 S 15th St, Sebring, OH 44672 and is currently estimated at $288,589, approximately $137 per square foot. 705 S 15th St is a home located in Mahoning County with nearby schools including B.L. Miller Elementary School and McKinley High School.
Ownership History
Date
Name
Owned For
Owner Type
Purchase Details
Closed on
Nov 22, 2010
Sold by
Butcher Jeffrey and Butcher Tammy
Bought by
Lucas Jay F and Lucas Sheila C
Current Estimated Value
Home Financials for this Owner
Home Financials are based on the most recent Mortgage that was taken out on this home.
Original Mortgage
$180,000
Outstanding Balance
$118,155
Interest Rate
4.17%
Mortgage Type
VA
Estimated Equity
$170,434
Purchase Details
Closed on
Aug 30, 2006
Sold by
Weingart Mary M
Bought by
Butcher Jeffrey and Butcher Tammy
Home Financials for this Owner
Home Financials are based on the most recent Mortgage that was taken out on this home.
Original Mortgage
$100,000
Interest Rate
6.88%
Mortgage Type
Purchase Money Mortgage
Purchase Details
Closed on
Jul 21, 1977
Bought by
Weingart Brooks E
Create a Home Valuation Report for This Property
The Home Valuation Report is an in-depth analysis detailing your home's value as well as a comparison with similar homes in the area
Home Values in the Area
Average Home Value in this Area
Purchase History
| Date | Buyer | Sale Price | Title Company |
|---|---|---|---|
| Lucas Jay F | $180,000 | Attorney | |
| Butcher Jeffrey | $195,000 | First American Title | |
| Weingart Brooks E | -- | -- |
Source: Public Records
Mortgage History
| Date | Status | Borrower | Loan Amount |
|---|---|---|---|
| Open | Lucas Jay F | $180,000 | |
| Closed | Butcher Jeffrey | $100,000 |
Source: Public Records
Tax History Compared to Growth
Tax History
| Year | Tax Paid | Tax Assessment Tax Assessment Total Assessment is a certain percentage of the fair market value that is determined by local assessors to be the total taxable value of land and additions on the property. | Land | Improvement |
|---|---|---|---|---|
| 2024 | $3,675 | $88,950 | $6,450 | $82,500 |
| 2023 | $3,433 | $88,950 | $6,450 | $82,500 |
| 2022 | $2,929 | $71,640 | $6,450 | $65,190 |
| 2021 | $2,822 | $71,640 | $6,450 | $65,190 |
| 2020 | $3,001 | $71,640 | $6,450 | $65,190 |
| 2019 | $2,799 | $61,230 | $6,450 | $54,780 |
| 2018 | $2,745 | $61,230 | $6,450 | $54,780 |
| 2017 | $2,742 | $61,230 | $6,450 | $54,780 |
| 2016 | $2,483 | $55,700 | $6,450 | $49,250 |
| 2015 | $2,414 | $55,700 | $6,450 | $49,250 |
| 2014 | $2,504 | $55,700 | $6,450 | $49,250 |
| 2013 | $2,460 | $55,700 | $6,450 | $49,250 |
Source: Public Records
Map
Nearby Homes
- 216 E Carolina Ave
- 439 S 15th St
- 104 W Carolina Ave
- 240 S 15th St
- 1246 S 12th St
- 495 W Texas Ave
- 145 N 17th St
- 236 E Ohio Ave
- 226 W Maryland Ave
- 245 E Maryland Ave
- 325 W Maryland Ave
- 495 W Ohio Ave
- 540 W Oregon Ave Unit 1/2
- 0 W Maryland Ave
- 876 Lake Park Blvd
- 406 W Indiana Ave
- 625 W Maryland Ave
- 11 Redwood St
- 670 W Maryland Ave
- 355 E Michigan Ave