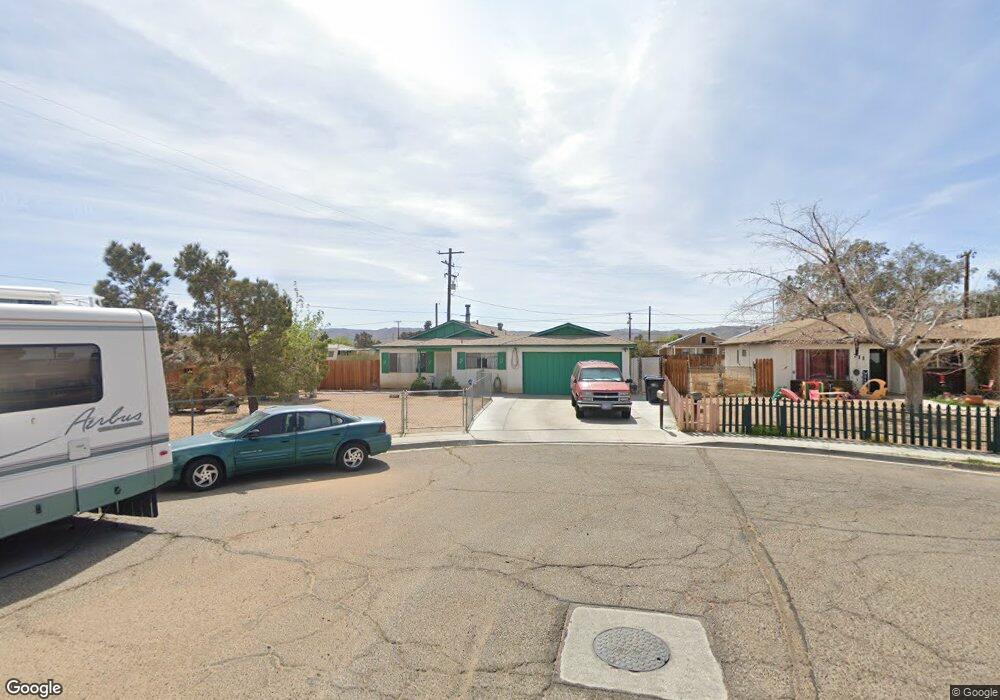
705 W Haloid Ave Ridgecrest, CA 93555
Estimated Value: $172,000 - $216,583
3
Beds
2
Baths
1,186
Sq Ft
$162/Sq Ft
Est. Value
About This Home
This home is located at 705 W Haloid Ave, Ridgecrest, CA 93555 and is currently estimated at $191,646, approximately $161 per square foot. 705 W Haloid Ave is a home located in Kern County with nearby schools including Faller Elementary School, James Monroe Middle School, and Burroughs High School.
Ownership History
Date
Name
Owned For
Owner Type
Purchase Details
Closed on
Aug 2, 2023
Sold by
Jones Eric
Bought by
Jones Megan Alyse
Current Estimated Value
Home Financials for this Owner
Home Financials are based on the most recent Mortgage that was taken out on this home.
Original Mortgage
$135,800
Outstanding Balance
$132,351
Interest Rate
6.67%
Mortgage Type
New Conventional
Estimated Equity
$59,295
Purchase Details
Closed on
Jun 19, 2023
Sold by
Fava Living Trust
Bought by
Jones Megan Alyse
Home Financials for this Owner
Home Financials are based on the most recent Mortgage that was taken out on this home.
Original Mortgage
$135,800
Outstanding Balance
$132,351
Interest Rate
6.67%
Mortgage Type
New Conventional
Estimated Equity
$59,295
Purchase Details
Closed on
Oct 21, 2022
Sold by
Fava Joan P
Bought by
Fava Living Trust
Create a Home Valuation Report for This Property
The Home Valuation Report is an in-depth analysis detailing your home's value as well as a comparison with similar homes in the area
Home Values in the Area
Average Home Value in this Area
Purchase History
| Date | Buyer | Sale Price | Title Company |
|---|---|---|---|
| Jones Megan Alyse | -- | Chicago Title Company | |
| Jones Megan Alyse | $140,000 | Chicago Title Company | |
| Fava Living Trust | -- | -- |
Source: Public Records
Mortgage History
| Date | Status | Borrower | Loan Amount |
|---|---|---|---|
| Open | Jones Megan Alyse | $135,800 |
Source: Public Records
Tax History
| Year | Tax Paid | Tax Assessment Tax Assessment Total Assessment is a certain percentage of the fair market value that is determined by local assessors to be the total taxable value of land and additions on the property. | Land | Improvement |
|---|---|---|---|---|
| 2025 | $2,022 | $142,800 | $35,700 | $107,100 |
| 2024 | $1,122 | $140,000 | $35,000 | $105,000 |
| 2023 | $1,122 | $59,721 | $6,900 | $52,821 |
| 2022 | $1,098 | $58,551 | $6,765 | $51,786 |
| 2021 | $1,036 | $57,404 | $6,633 | $50,771 |
| 2020 | $1,036 | $56,816 | $6,565 | $50,251 |
| 2019 | $991 | $56,816 | $6,565 | $50,251 |
| 2018 | $978 | $54,611 | $6,311 | $48,300 |
| 2017 | $975 | $53,541 | $6,188 | $47,353 |
| 2016 | $940 | $52,492 | $6,067 | $46,425 |
| 2015 | $923 | $51,704 | $5,976 | $45,728 |
| 2014 | $806 | $50,692 | $5,859 | $44,833 |
Source: Public Records
Map
Nearby Homes
- 341 S Gordon St
- 609 Lakeview Ct
- 309 S Norma St
- 1320 W Saint George Ave
- 0 W Saint George Ave
- 239 Sunset Place
- 421 Petris Ave
- 429 Dewalt Ave
- 428 Thomas St
- 0 W Boston Ave
- 424 S Inyo St
- 336 W Wilson Ave
- 417 S Inyo St
- 0 W Coronado Ave Unit 25003301
- 0 W Coronado Ave Unit SR25097540
- 405 Rick Ct
- 313 W Robertson Rd
- 313 W Church Ave
- 081-341-08 Mariposa Ave
- 509-090-30 Bowman Rd
- 711 W Haloid Ave
- 717 W Haloid Ave
- 718 W Upjohn Ave
- 706 W Haloid Ave
- 712 W Haloid Ave
- 723 W Haloid Ave
- 718 W Haloid Ave
- 724 W Haloid Ave
- 729 W Haloid Ave
- 407 S Sierra View St
- 620 Upjohn Sp 62
- 711 W Wilson Ave
- 705 W Wilson Ave
- 717 W Wilson Ave
- 735 W Haloid Ave
- 740 W Upjohn Ave
- 723 W Wilson Ave
- 425 S Margalo St
- 419 S Margalo St
- 741 W Haloid Ave