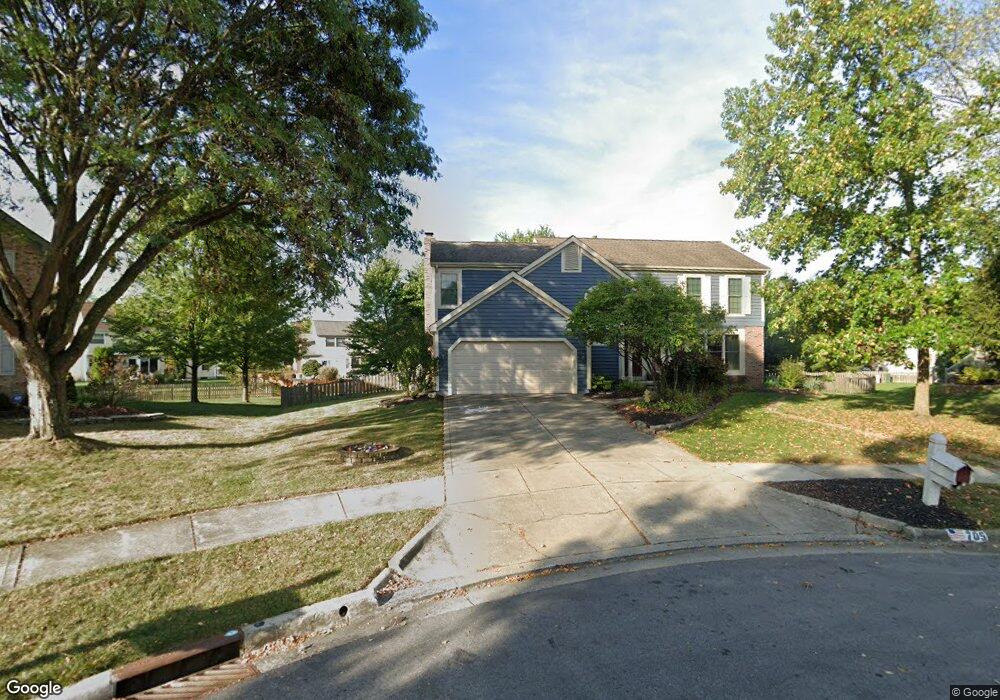
705 Whithorn Ct Westerville, OH 43081
Estimated Value: $503,000 - $537,000
4
Beds
3
Baths
2,464
Sq Ft
$212/Sq Ft
Est. Value
About This Home
This home is located at 705 Whithorn Ct, Westerville, OH 43081 and is currently estimated at $521,463, approximately $211 per square foot. 705 Whithorn Ct is a home located in Franklin County with nearby schools including Mcvay Elementary School, Walnut Springs Middle School, and Westerville Central High School.
Ownership History
Date
Name
Owned For
Owner Type
Purchase Details
Closed on
Feb 26, 2004
Sold by
Walker Richard E and Armstrong Debra M
Bought by
Bender Donald G and Bender Brenda M
Current Estimated Value
Home Financials for this Owner
Home Financials are based on the most recent Mortgage that was taken out on this home.
Original Mortgage
$201,450
Interest Rate
4.87%
Mortgage Type
Purchase Money Mortgage
Purchase Details
Closed on
Sep 14, 2000
Sold by
Swanson C Richard
Bought by
Walker Richard E and Armstrong Debra M
Home Financials for this Owner
Home Financials are based on the most recent Mortgage that was taken out on this home.
Original Mortgage
$178,950
Interest Rate
8.14%
Purchase Details
Closed on
Jun 1, 1998
Sold by
Richard Swanson C and Richard Roberta L
Bought by
Swanson C Richard and Roberta Lois Swanson Trust
Purchase Details
Closed on
May 1, 1990
Create a Home Valuation Report for This Property
The Home Valuation Report is an in-depth analysis detailing your home's value as well as a comparison with similar homes in the area
Home Values in the Area
Average Home Value in this Area
Purchase History
| Date | Buyer | Sale Price | Title Company |
|---|---|---|---|
| Bender Donald G | $237,000 | -- | |
| Walker Richard E | $223,700 | Stewart Title Agency Of Colu | |
| Swanson C Richard | -- | -- | |
| -- | $162,900 | -- |
Source: Public Records
Mortgage History
| Date | Status | Borrower | Loan Amount |
|---|---|---|---|
| Previous Owner | Bender Donald G | $201,450 | |
| Previous Owner | Walker Richard E | $178,950 |
Source: Public Records
Tax History Compared to Growth
Tax History
| Year | Tax Paid | Tax Assessment Tax Assessment Total Assessment is a certain percentage of the fair market value that is determined by local assessors to be the total taxable value of land and additions on the property. | Land | Improvement |
|---|---|---|---|---|
| 2024 | $8,189 | $144,100 | $34,930 | $109,170 |
| 2023 | $8,016 | $144,095 | $34,930 | $109,165 |
| 2022 | $8,527 | $117,040 | $21,000 | $96,040 |
| 2021 | $8,599 | $117,040 | $21,000 | $96,040 |
| 2020 | $8,574 | $117,040 | $21,000 | $96,040 |
| 2019 | $6,994 | $90,130 | $17,500 | $72,630 |
| 2018 | $6,740 | $90,130 | $17,500 | $72,630 |
| 2017 | $6,858 | $90,130 | $17,500 | $72,630 |
| 2016 | $6,838 | $81,560 | $19,850 | $61,710 |
| 2015 | $6,623 | $81,560 | $19,850 | $61,710 |
| 2014 | $6,628 | $81,560 | $19,850 | $61,710 |
| 2013 | $3,151 | $77,665 | $18,900 | $58,765 |
Source: Public Records
Map
Nearby Homes
- 6506 Purplefinch Ct
- 806 Watten Ln
- 4432 Scissortail Loop
- 6360 Thrasher Loop
- 6352 Hibiscus Ct
- 5888 Montevideo Rd
- 5769 Montevideo Rd
- 6006 Carnation Dr
- 1019 Swanton Ct
- 1015 Swanton Ct
- 4765 Smoketalk Ln Unit 1
- 5769 Burntwood Way
- 4758 Crazy Horse Ln Unit 2
- 4755 Crazy Horse Ln Unit 6
- 640 Brook Run Dr
- 4786 Crazy Horse Ln Unit 2
- 4816 Crazy Horse Ln Unit 4
- 6874 Flatlands Rd
- 800 S Spring Rd
- 4775 Powderhorn Ln Unit 3
- 709 Whithorn Ct
- 702 Whitehorn Ct
- 702 Whithorn Ct
- 1310 Winfree Dr
- 678 Westray Dr
- 1300 Winfree Dr
- 688 Westray Dr
- 1290 Winfree Dr
- 713 Whithorn Ct
- 702 Westray Dr
- 1282 Winfree Dr
- 710 Whithorn Ct
- 710 Westray Dr
- 1274 Winfree Dr
- 721 Whithorn Ct
- 718 Whithorn Ct
- 718 Westray Dr
- 640 Whilehaven Ct
- 681 Winsholen Ct
- 1266 Winfree Dr