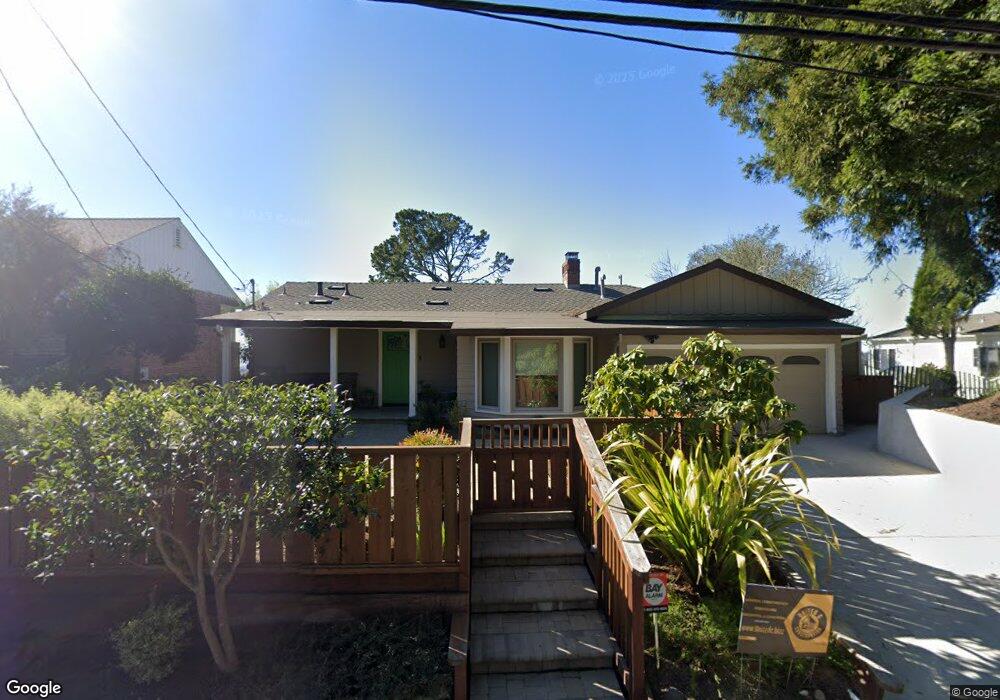
7051 Colton Blvd Oakland, CA 94611
Montclair NeighborhoodEstimated Value: $1,186,000 - $1,729,000
3
Beds
3
Baths
2,500
Sq Ft
$565/Sq Ft
Est. Value
About This Home
This home is located at 7051 Colton Blvd, Oakland, CA 94611 and is currently estimated at $1,413,748, approximately $565 per square foot. 7051 Colton Blvd is a home located in Alameda County with nearby schools including Montclair Elementary School, Montera Middle School, and Skyline High School.
Ownership History
Date
Name
Owned For
Owner Type
Purchase Details
Closed on
Apr 9, 2015
Sold by
Thomson Cynthia J and Cynthia J Thomson Trust
Bought by
Thomson Cynthia J
Current Estimated Value
Home Financials for this Owner
Home Financials are based on the most recent Mortgage that was taken out on this home.
Original Mortgage
$417,000
Outstanding Balance
$152,674
Interest Rate
3.7%
Mortgage Type
New Conventional
Estimated Equity
$1,261,074
Purchase Details
Closed on
Mar 23, 2015
Sold by
Coenen Robin Gerlach and The Gerlach Family Revocable T
Bought by
Thomson Cynthia J and Cynthia J Thomson Trust
Home Financials for this Owner
Home Financials are based on the most recent Mortgage that was taken out on this home.
Original Mortgage
$417,000
Outstanding Balance
$152,674
Interest Rate
3.7%
Mortgage Type
New Conventional
Estimated Equity
$1,261,074
Purchase Details
Closed on
May 29, 2013
Sold by
Gerlach Coenen Robin Gerlach and Gerlach Richard L
Bought by
Coenen Robin Gerlach and Gerlach Family Revocable Trust
Create a Home Valuation Report for This Property
The Home Valuation Report is an in-depth analysis detailing your home's value as well as a comparison with similar homes in the area
Home Values in the Area
Average Home Value in this Area
Purchase History
| Date | Buyer | Sale Price | Title Company |
|---|---|---|---|
| Thomson Cynthia J | -- | Old Republic Title Company | |
| Thomson Cynthia J | -- | Accommodation | |
| Thomson Cynthia J | $1,100,000 | Old Republic Title Company | |
| Coenen Robin Gerlach | -- | None Available |
Source: Public Records
Mortgage History
| Date | Status | Borrower | Loan Amount |
|---|---|---|---|
| Open | Thomson Cynthia J | $417,000 |
Source: Public Records
Tax History
| Year | Tax Paid | Tax Assessment Tax Assessment Total Assessment is a certain percentage of the fair market value that is determined by local assessors to be the total taxable value of land and additions on the property. | Land | Improvement |
|---|---|---|---|---|
| 2025 | $11,772 | $815,311 | $448,534 | $373,777 |
| 2024 | $11,772 | $799,190 | $439,741 | $366,449 |
| 2023 | $12,392 | $790,385 | $431,120 | $359,265 |
| 2022 | $12,081 | $767,888 | $422,667 | $352,221 |
| 2021 | $11,595 | $752,697 | $414,381 | $345,316 |
| 2020 | $11,465 | $751,911 | $410,134 | $341,777 |
| 2019 | $11,059 | $737,173 | $402,095 | $335,078 |
| 2018 | $10,820 | $722,722 | $394,213 | $328,509 |
| 2017 | $10,410 | $708,551 | $386,483 | $322,068 |
| 2016 | $15,972 | $1,119,774 | $335,032 | $784,742 |
| 2015 | $4,535 | $263,721 | $184,882 | $78,839 |
| 2014 | $4,471 | $258,556 | $181,261 | $77,295 |
Source: Public Records
Map
Nearby Homes
- 7030 Snake Rd
- 58 Villanova Dr
- 0 Villanova Dr
- 1925 Manzanita Dr
- 6825 Saroni Dr
- 6842 Armour Dr
- 6595 Thornhill Dr
- 6587 Thornhill Dr
- 0 Arrowhead Dr Unit 41120111
- 6567 Thornhill Dr
- 6956 Sayre Dr
- 7243 Thorndale Dr
- 7075 Elverton Dr
- 18 Conrad Ct
- 0 Willowbank Ct
- 00 Willowbank Ct
- 6688 Colton Blvd
- 7875 Skyline Blvd
- 0000 Woodrow Dr
- 0 Lauriston Ct Unit 225114614
- 7045 Colton Blvd
- 7065 Colton Blvd
- 7031 Colton Blvd
- 7293 Snake Rd
- 7285 Snake Rd
- 7081 Colton Blvd
- 7301 Snake Rd
- 1601 Arrowhead Dr
- 7279 Snake Rd
- 7305 Snake Rd
- 7021 Colton Blvd
- 7028 Colton Blvd
- 7309 Snake Rd
- 1605 Arrowhead Dr
- 7273 Snake Rd
- 1615 Arrowhead Dr
- 7020 Colton Blvd
- 7315 Snake Rd
- 7036 Colton Blvd
- 7011 Colton Blvd
Your Personal Tour Guide
Ask me questions while you tour the home.