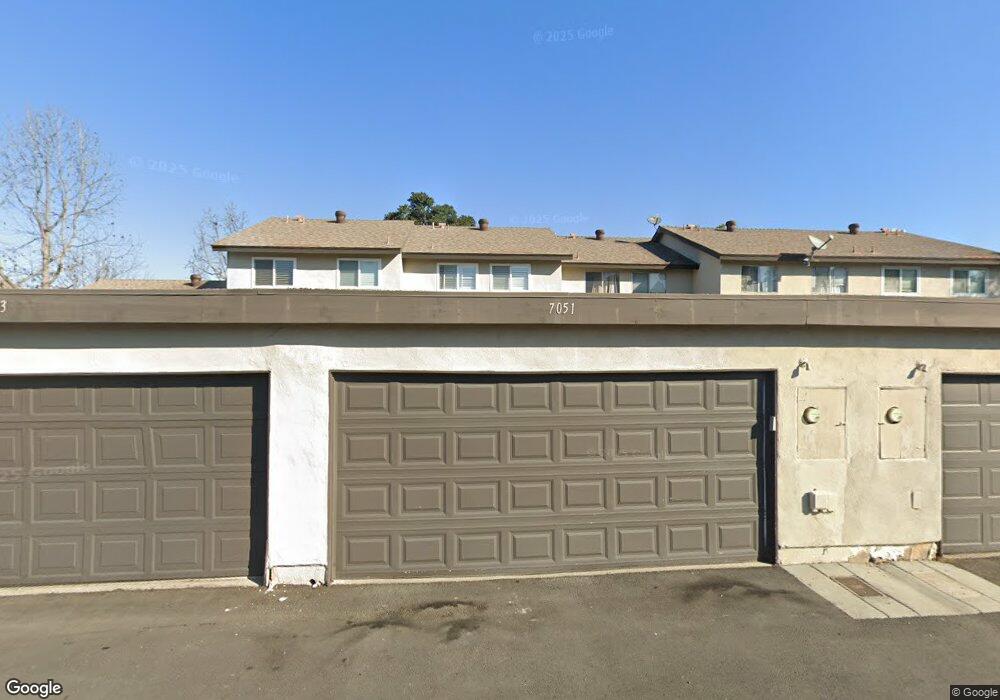
7051 Fulton Way Stanton, CA 90680
Estimated Value: $628,000 - $679,000
3
Beds
2
Baths
1,121
Sq Ft
$582/Sq Ft
Est. Value
About This Home
This home is located at 7051 Fulton Way, Stanton, CA 90680 and is currently estimated at $651,954, approximately $581 per square foot. 7051 Fulton Way is a home located in Orange County with nearby schools including Bryant Elementary School, Hilton D. Bell Intermediate School, and Pacifica High School.
Ownership History
Date
Name
Owned For
Owner Type
Purchase Details
Closed on
Dec 17, 2013
Sold by
Castaneda Amnery M
Bought by
Castaneda Amnery M
Current Estimated Value
Home Financials for this Owner
Home Financials are based on the most recent Mortgage that was taken out on this home.
Original Mortgage
$205,000
Outstanding Balance
$152,739
Interest Rate
4.13%
Mortgage Type
New Conventional
Estimated Equity
$499,215
Purchase Details
Closed on
Aug 8, 2008
Sold by
Castaneda Luis A and Castaneda Virginia
Bought by
Castaneda Amnery M
Purchase Details
Closed on
Jan 24, 2002
Sold by
Holper James A and Holper Patricia S
Bought by
Castaneda Luis A and Castaneda Virginia
Home Financials for this Owner
Home Financials are based on the most recent Mortgage that was taken out on this home.
Original Mortgage
$161,910
Interest Rate
7.13%
Create a Home Valuation Report for This Property
The Home Valuation Report is an in-depth analysis detailing your home's value as well as a comparison with similar homes in the area
Home Values in the Area
Average Home Value in this Area
Purchase History
| Date | Buyer | Sale Price | Title Company |
|---|---|---|---|
| Castaneda Amnery M | -- | Lsi Title Company | |
| Castaneda Amnery M | -- | None Available | |
| Castaneda Luis A | $180,000 | American Title Co |
Source: Public Records
Mortgage History
| Date | Status | Borrower | Loan Amount |
|---|---|---|---|
| Open | Castaneda Amnery M | $205,000 | |
| Previous Owner | Castaneda Luis A | $161,910 |
Source: Public Records
Tax History Compared to Growth
Tax History
| Year | Tax Paid | Tax Assessment Tax Assessment Total Assessment is a certain percentage of the fair market value that is determined by local assessors to be the total taxable value of land and additions on the property. | Land | Improvement |
|---|---|---|---|---|
| 2025 | $3,257 | $265,753 | $175,290 | $90,463 |
| 2024 | $3,257 | $260,543 | $171,853 | $88,690 |
| 2023 | $3,194 | $255,435 | $168,484 | $86,951 |
| 2022 | $3,145 | $250,427 | $165,180 | $85,247 |
| 2021 | $3,114 | $245,517 | $161,941 | $83,576 |
| 2020 | $3,076 | $243,000 | $160,280 | $82,720 |
| 2019 | $3,002 | $238,236 | $157,137 | $81,099 |
| 2018 | $2,953 | $233,565 | $154,056 | $79,509 |
| 2017 | $2,911 | $228,986 | $151,036 | $77,950 |
| 2016 | $2,792 | $224,497 | $148,075 | $76,422 |
| 2015 | $2,756 | $221,125 | $145,850 | $75,275 |
| 2014 | $2,665 | $216,794 | $142,993 | $73,801 |
Source: Public Records
Map
Nearby Homes
- 11058 Grant Way
- 6837 Amelia Way
- 11219 Hood Way
- 6870 Via Kannela
- 11390 Nantucket Ct
- 7271 Katella Ave Unit 58
- 7271 Katella Ave
- 7271 Katella Ave Unit 101
- 7271 Katella Ave Unit 9
- 7271 Katella Ave Unit 84
- 11081 Robinson Dr
- 10700 Knott Ave
- 10720 Knott Ave
- 10663 Bell St Unit 1
- 10601 Knott Ave
- 7100 Cerritos Ave Unit 85
- 7160 Cerritos Ave
- 3555 W Cerritos Ave
- 7344 W Cerritos Ave Unit 3
- 10411 Lexington St
- 7055 Fulton Way
- 7043 Fulton Way
- 7061 Fulton Way
- 7041 Fulton Way
- 7067 Fulton Way
- 7071 Fulton Way
- 7050 Fulton Way
- 7054 Fulton Way
- 7042 Fulton Way
- 7060 Fulton Way
- 7066 Fulton Way
- 7040 Fulton Way
- 7070 Fulton Way
- 7081 Fulton Way
- 7036 Fulton Way
- 11110 Lambert Way
- 11108 Lambert Way
- 11106 Lambert Way
- 11104 Lambert Way
- 7032 Fulton Way