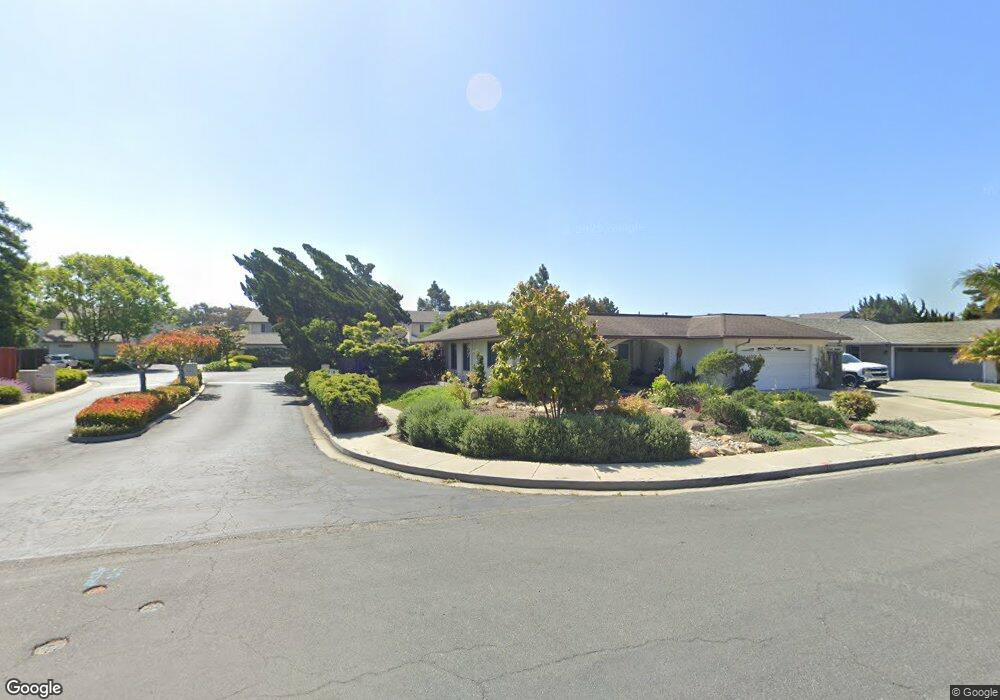
7054 Marymount Way Unit 7 Goleta, CA 93117
Estimated Value: $798,115 - $921,000
2
Beds
2
Baths
1,010
Sq Ft
$862/Sq Ft
Est. Value
About This Home
This home is located at 7054 Marymount Way Unit 7, Goleta, CA 93117 and is currently estimated at $870,779, approximately $862 per square foot. 7054 Marymount Way Unit 7 is a home located in Santa Barbara County with nearby schools including Isla Vista Elementary School, Goleta Valley Junior High School, and Dos Pueblos Senior High School.
Ownership History
Date
Name
Owned For
Owner Type
Purchase Details
Closed on
May 14, 2020
Sold by
Herzog Amy L
Bought by
Herzog Amy and Amy Herzog Living Trust
Current Estimated Value
Purchase Details
Closed on
Nov 5, 2015
Sold by
Herzog Erik T
Bought by
Herzog Amy L
Purchase Details
Closed on
May 19, 2000
Sold by
Drinkwater James F and Drinkwater Patricia M
Bought by
Farrington Mary Jo
Home Financials for this Owner
Home Financials are based on the most recent Mortgage that was taken out on this home.
Original Mortgage
$192,600
Interest Rate
8.15%
Purchase Details
Closed on
Aug 18, 1998
Sold by
Alfsen Patricia M and Alfsen Patricia M
Bought by
Drinkwater James F and Drinkwater Patricia M
Home Financials for this Owner
Home Financials are based on the most recent Mortgage that was taken out on this home.
Original Mortgage
$172,500
Interest Rate
6.91%
Create a Home Valuation Report for This Property
The Home Valuation Report is an in-depth analysis detailing your home's value as well as a comparison with similar homes in the area
Home Values in the Area
Average Home Value in this Area
Purchase History
| Date | Buyer | Sale Price | Title Company |
|---|---|---|---|
| Herzog Amy | -- | None Available | |
| Herzog Amy L | -- | Fidelity National Title Co | |
| Herzog Amy L | $339,500 | Fidelity National Title Co | |
| Farrington Mary Jo | $241,000 | Fidelity National Title Co | |
| Drinkwater James F | -- | Fidelity National Title Co |
Source: Public Records
Mortgage History
| Date | Status | Borrower | Loan Amount |
|---|---|---|---|
| Previous Owner | Farrington Mary Jo | $192,600 | |
| Previous Owner | Drinkwater James F | $172,500 | |
| Closed | Herzog Amy L | $0 |
Source: Public Records
Tax History
| Year | Tax Paid | Tax Assessment Tax Assessment Total Assessment is a certain percentage of the fair market value that is determined by local assessors to be the total taxable value of land and additions on the property. | Land | Improvement |
|---|---|---|---|---|
| 2025 | $4,544 | $401,652 | $200,826 | $200,826 |
| 2023 | $4,544 | $386,058 | $193,029 | $193,029 |
| 2022 | $4,275 | $378,490 | $189,245 | $189,245 |
| 2021 | $4,204 | $371,070 | $185,535 | $185,535 |
| 2020 | $4,097 | $367,266 | $183,633 | $183,633 |
| 2019 | $4,024 | $360,066 | $180,033 | $180,033 |
| 2018 | $3,950 | $353,006 | $176,503 | $176,503 |
| 2017 | $3,887 | $346,086 | $173,043 | $173,043 |
| 2016 | $3,804 | $339,300 | $169,650 | $169,650 |
| 2015 | $3,468 | $307,870 | $153,455 | $154,415 |
| 2014 | $3,398 | $301,841 | $150,450 | $151,391 |
Source: Public Records
Map
Nearby Homes
- 516 Mills Way
- 541 Sweet Rain Place
- 470 Orange Blossom Ln
- 363 Cannon Green Dr Unit F
- 405 Ellwood Beach Dr Unit B
- 7380 Elmhurst Place
- 7465 Hollister Ave Unit Condo Unit 130
- 7465 Hollister Ave Unit Condo 130
- 7465 Hollister Ave Unit 423
- 7465 Hollister Ave Unit 329
- 7368 Hollister Ave Unit Spc 37
- 7368 Hollister Ave Unit 27
- 7368 Hollister Ave Unit Spc 28
- 7465 Hollister Avenue Condo #337
- 7415 San Bergamo Dr
- 64 Sonoma Ave
- 1000 Calle Real
- 7075 Del Norte Dr
- 7039 Del Norte Dr
- 6789 Sabado Tarde Rd
- 7052 Marymount Way
- 7050 Marymount Way
- 7048 Marymount Way
- 7056 Marymount Dr
- 7056 Marymount Way
- 7046 Marymount Way
- 7060 Marymount Dr
- 7060 Marymount Way
- 7058 Marymount Way
- 7044 Marymount Way
- 7062 Marymount Way
- 7037 Marymount Way
- 7071 Marymount Way
- 7023 Marymount Way
- 7042 Marymount Way
- 7017 Marymount Way
- 7061 Marymount Way
- 7031 Marymount Way
- 7017 Marymount Way
- 7019 Marymount Way
Your Personal Tour Guide
Ask me questions while you tour the home.