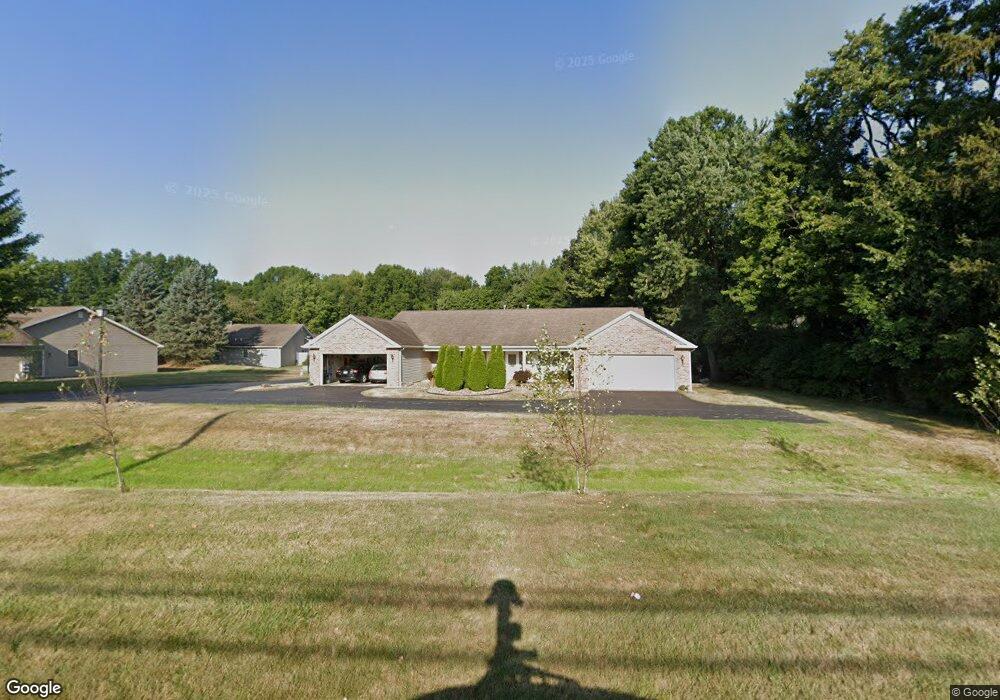
7054 West Blvd Unit 2 Youngstown, OH 44512
Estimated Value: $188,000 - $203,000
2
Beds
2
Baths
1,320
Sq Ft
$146/Sq Ft
Est. Value
About This Home
This home is located at 7054 West Blvd Unit 2, Youngstown, OH 44512 and is currently estimated at $192,571, approximately $145 per square foot. 7054 West Blvd Unit 2 is a home located in Mahoning County with nearby schools including West Boulevard Elementary School, Boardman Center Middle School, and Boardman High School.
Ownership History
Date
Name
Owned For
Owner Type
Purchase Details
Closed on
Jan 24, 2024
Sold by
Tkach Frank R and Tkach Mary Beth
Bought by
Valentini Joseph A
Current Estimated Value
Home Financials for this Owner
Home Financials are based on the most recent Mortgage that was taken out on this home.
Original Mortgage
$166,250
Outstanding Balance
$163,149
Interest Rate
6.61%
Mortgage Type
New Conventional
Estimated Equity
$29,422
Purchase Details
Closed on
Aug 6, 2007
Sold by
Slavins Stephen
Bought by
Tkach Frank R and Tkach Mary Beth
Purchase Details
Closed on
Jun 8, 2006
Sold by
Haiberg Gwyneth V
Bought by
Slavins Stephen
Purchase Details
Closed on
Oct 8, 1999
Sold by
Mcpherson Richard P and Wright Jane L
Bought by
Halberg Gwyneth
Purchase Details
Closed on
Jul 9, 1991
Bought by
Mcpherson Richard P
Create a Home Valuation Report for This Property
The Home Valuation Report is an in-depth analysis detailing your home's value as well as a comparison with similar homes in the area
Home Values in the Area
Average Home Value in this Area
Purchase History
| Date | Buyer | Sale Price | Title Company |
|---|---|---|---|
| Valentini Joseph A | $175,000 | None Listed On Document | |
| Valentini Joseph A | $175,000 | None Listed On Document | |
| Tkach Frank R | $116,000 | Attorney | |
| Slavins Stephen | $117,000 | None Available | |
| Halberg Gwyneth | $114,000 | -- | |
| Mcpherson Richard P | -- | -- |
Source: Public Records
Mortgage History
| Date | Status | Borrower | Loan Amount |
|---|---|---|---|
| Open | Valentini Joseph A | $166,250 | |
| Closed | Valentini Joseph A | $166,250 |
Source: Public Records
Tax History Compared to Growth
Tax History
| Year | Tax Paid | Tax Assessment Tax Assessment Total Assessment is a certain percentage of the fair market value that is determined by local assessors to be the total taxable value of land and additions on the property. | Land | Improvement |
|---|---|---|---|---|
| 2024 | $2,276 | $45,020 | $6,130 | $38,890 |
| 2023 | $2,245 | $45,020 | $6,130 | $38,890 |
| 2022 | $2,342 | $35,960 | $6,140 | $29,820 |
| 2021 | $2,344 | $35,960 | $6,140 | $29,820 |
| 2020 | $2,356 | $35,960 | $6,140 | $29,820 |
| 2019 | $2,248 | $30,740 | $5,250 | $25,490 |
| 2018 | $2,089 | $30,740 | $5,250 | $25,490 |
| 2017 | $1,980 | $30,740 | $5,250 | $25,490 |
| 2016 | $2,013 | $31,480 | $5,250 | $26,230 |
| 2015 | $1,973 | $31,480 | $5,250 | $26,230 |
| 2014 | $1,978 | $31,480 | $5,250 | $26,230 |
| 2013 | $1,953 | $31,480 | $5,250 | $26,230 |
Source: Public Records
Map
Nearby Homes
- 6938 Ron Park Place
- 813 Brookfield Ave
- 6632 Harrington Ave
- 772 Ewing Rd
- 396 Brookfield Ave
- 0 Pinewood Dr Unit 5140025
- 6892 Glenwood Ave
- 715 Crestview Dr
- 7544 Jaguar Dr
- 7556 Jaguar Dr
- 768 Crestview Dr
- 7005 Paxton Rd
- 242 Oakley Ave
- 7367 Oregon Trail
- 7511 E Parkside Dr
- 7387 Oregon Trail
- 7603 Red Fox Dr
- 6726 Glendale Ave
- 7110 Amherst Ave
- 96 Aylesboro Ave
- 7054 West Blvd Unit 1
- 7054 West Blvd
- 7050 West Blvd Unit 2
- 7050 West Blvd Unit 1
- 7056 West Blvd Unit 2
- 7056 West Blvd Unit 1
- 6998 West Blvd
- 7058 West Blvd Unit 2
- 7058 West Blvd Unit 1
- 7052 West Blvd Unit 2
- 7052 West Blvd Unit 1
- 7052 West Blvd
- 7060 West Blvd Unit 2
- 7060 West Blvd Unit 1
- 7060 West Blvd
- 6992 West Blvd
- 7062 West Blvd Unit 2
- 7062 West Blvd Unit 1
- 7066 West Blvd Unit 2
- 7066 West Blvd Unit 1