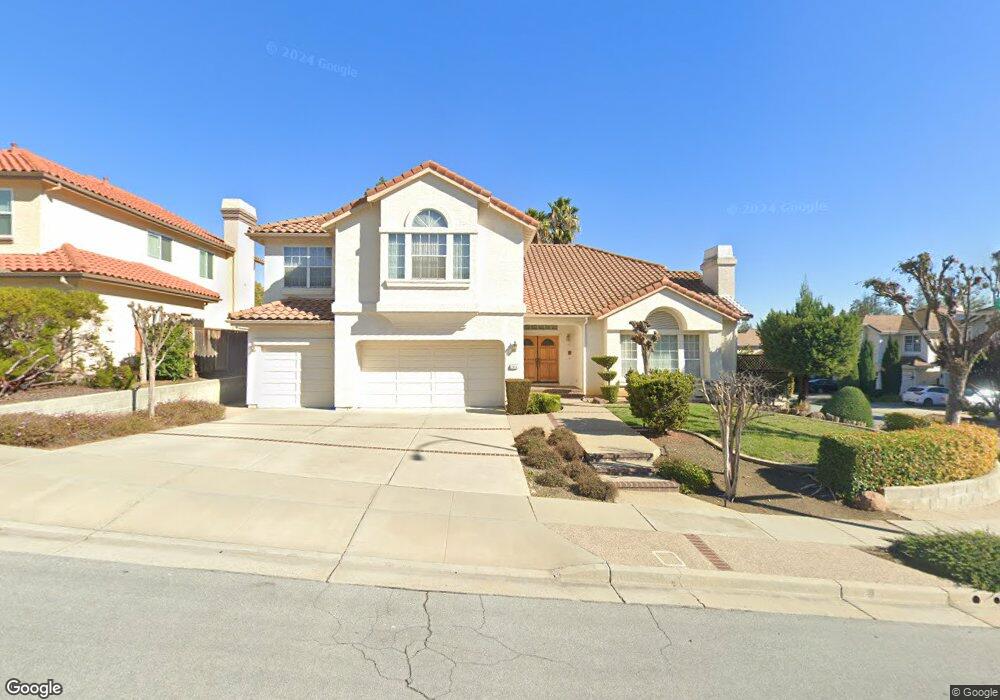
7058 Sterling Gate Ct San Jose, CA 95120
Almaden Springs NeighborhoodEstimated Value: $2,871,299 - $3,249,000
4
Beds
4
Baths
3,424
Sq Ft
$878/Sq Ft
Est. Value
About This Home
This home is located at 7058 Sterling Gate Ct, San Jose, CA 95120 and is currently estimated at $3,005,825, approximately $877 per square foot. 7058 Sterling Gate Ct is a home located in Santa Clara County with nearby schools including Williams Elementary School, Bret Harte Middle School, and Leland High School.
Ownership History
Date
Name
Owned For
Owner Type
Purchase Details
Closed on
Aug 26, 2009
Sold by
Chiang Chenhuei J and Chiang Bin
Bought by
Chiang Chenhuei J and Chiang Bin
Current Estimated Value
Create a Home Valuation Report for This Property
The Home Valuation Report is an in-depth analysis detailing your home's value as well as a comparison with similar homes in the area
Home Values in the Area
Average Home Value in this Area
Purchase History
| Date | Buyer | Sale Price | Title Company |
|---|---|---|---|
| Chiang Chenhuei J | -- | None Available |
Source: Public Records
Tax History Compared to Growth
Tax History
| Year | Tax Paid | Tax Assessment Tax Assessment Total Assessment is a certain percentage of the fair market value that is determined by local assessors to be the total taxable value of land and additions on the property. | Land | Improvement |
|---|---|---|---|---|
| 2025 | $13,543 | $1,069,838 | $442,078 | $627,760 |
| 2024 | $13,543 | $1,048,861 | $433,410 | $615,451 |
| 2023 | $13,288 | $1,028,296 | $424,912 | $603,384 |
| 2022 | $13,173 | $1,008,134 | $416,581 | $591,553 |
| 2021 | $12,909 | $988,367 | $408,413 | $579,954 |
| 2020 | $12,622 | $978,234 | $404,226 | $574,008 |
| 2019 | $12,355 | $959,053 | $396,300 | $562,753 |
| 2018 | $12,234 | $940,249 | $388,530 | $551,719 |
| 2017 | $12,137 | $921,813 | $380,912 | $540,901 |
| 2016 | $11,940 | $903,740 | $373,444 | $530,296 |
| 2015 | $11,864 | $890,166 | $367,835 | $522,331 |
| 2014 | $11,396 | $872,730 | $360,630 | $512,100 |
Source: Public Records
Map
Nearby Homes
- 1128 Foxhurst Way
- 1120 Valley Quail Cir
- 1066 Quail Creek Cir
- 21287 Almaden Rd
- 1261 Quail Creek Cir
- 993 Woodview Place
- 1140 Mallard Ridge Loop
- 7025 Bret Harte Dr
- 1171 Wilhelmina Way
- 7266 Sleepy Creek Dr
- 6997 Elwood Rd
- 7111 Echo Loop
- 6871 Tunbridge Way
- 6898 Shearwater Dr
- 765 Finchwood Way
- 6840 Hampton Dr
- 6805 Almaden Rd
- 6803 Lenwood Way
- 6698 Charter Oak Place
- 1238 Wooded Hills Dr
- 7054 Sterling Gate Ct
- 7053 Huntsfield Ct
- 7049 Huntsfield Ct
- 1124 Sterling Gate Dr
- 7000 Sterling Gate Ct
- 7055 Sterling Gate Ct
- 1120 Sterling Gate Dr
- 7051 Sterling Gate Ct
- 7045 Huntsfield Ct
- 1132 Sterling Gate Dr
- 1116 Sterling Gate Dr
- 7047 Sterling Gate Ct
- 1136 Sterling Gate Dr
- 1137 Sterling Gate Dr
- 1112 Sterling Gate Dr
- 7056 Huntsfield Ct
- 7052 Huntsfield Ct
- 1140 Sterling Gate Dr
- 1141 Sterling Gate Dr
- 1108 Sterling Gate Dr