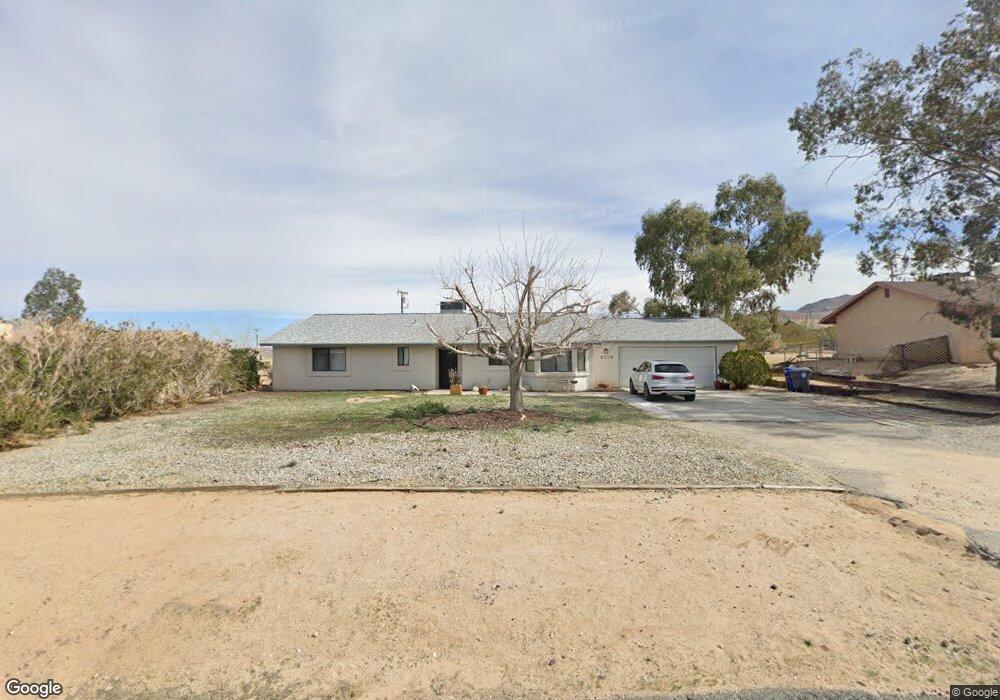
7059 Ivanpah Ave Twentynine Palms, CA 92277
Estimated Value: $313,185 - $395,000
3
Beds
2
Baths
1,720
Sq Ft
$213/Sq Ft
Est. Value
About This Home
This home is located at 7059 Ivanpah Ave, Twentynine Palms, CA 92277 and is currently estimated at $366,796, approximately $213 per square foot. 7059 Ivanpah Ave is a home located in San Bernardino County with nearby schools including Oasis Elementary School, Twentynine Palms Junior High School, and Twentynine Palms High School.
Ownership History
Date
Name
Owned For
Owner Type
Purchase Details
Closed on
Apr 2, 2021
Sold by
Allen Wesley and Allen Elisa Y
Bought by
Allen Elisa Y
Current Estimated Value
Purchase Details
Closed on
Aug 6, 2001
Sold by
Vantol Jon C
Bought by
Allen Wesley and Allen Elisa Y
Home Financials for this Owner
Home Financials are based on the most recent Mortgage that was taken out on this home.
Original Mortgage
$98,000
Outstanding Balance
$37,814
Interest Rate
7%
Mortgage Type
VA
Estimated Equity
$328,982
Purchase Details
Closed on
May 20, 1994
Sold by
Vantol Alyda L
Bought by
Vantol Jon C and Vantol Amelia E
Create a Home Valuation Report for This Property
The Home Valuation Report is an in-depth analysis detailing your home's value as well as a comparison with similar homes in the area
Home Values in the Area
Average Home Value in this Area
Purchase History
| Date | Buyer | Sale Price | Title Company |
|---|---|---|---|
| Allen Elisa Y | -- | Amrock Inc | |
| Allen Wesley | $98,000 | First American Title | |
| Vantol Jon C | -- | -- |
Source: Public Records
Mortgage History
| Date | Status | Borrower | Loan Amount |
|---|---|---|---|
| Open | Allen Wesley | $98,000 |
Source: Public Records
Tax History Compared to Growth
Tax History
| Year | Tax Paid | Tax Assessment Tax Assessment Total Assessment is a certain percentage of the fair market value that is determined by local assessors to be the total taxable value of land and additions on the property. | Land | Improvement |
|---|---|---|---|---|
| 2025 | $2,020 | $144,779 | $14,480 | $130,299 |
| 2024 | $2,020 | $141,940 | $14,196 | $127,744 |
| 2023 | $1,949 | $139,157 | $13,918 | $125,239 |
| 2022 | $1,904 | $136,428 | $13,645 | $122,783 |
| 2021 | $1,808 | $133,752 | $13,377 | $120,375 |
| 2020 | $1,787 | $132,381 | $13,240 | $119,141 |
| 2019 | $1,737 | $129,785 | $12,980 | $116,805 |
| 2018 | $1,695 | $127,240 | $12,725 | $114,515 |
| 2017 | $1,672 | $124,745 | $12,475 | $112,270 |
| 2016 | $1,640 | $122,299 | $12,230 | $110,069 |
| 2015 | $1,540 | $120,462 | $12,046 | $108,416 |
| 2014 | $1,529 | $118,102 | $11,810 | $106,292 |
Source: Public Records
Map
Nearby Homes
- 0 Ivanpah Ave Unit CV25172617
- 6789 Copper Mountain Rd
- 6646 Quail Spring Ave
- 69235 Old Dale Rd
- 6548 Quail Spring Ave
- 111 S 29 Palms Outer Hwy
- 207 Indian Cir
- 29 Palms Hwy
- 6425 Indian Cove Rd
- 68054 Sullivan Rd
- 2.5 Acres On Hwy 62 Near Kern Blvd
- 2.5 Acres On Hwy 62 Near Hendy's Rd
- 70138 Sullivan Rd
- 5440 Shoshone Valley Rd
- 5400 Shoshone Valley Rd
- 6976 Sherman Rd
- 6767 Peterson Rd
- 0 Sheridan Rd Unit OC23054129
- 6667 Peterson Rd
- 7049 Ivanpah Ave
- 7073 Ivanpah Ave
- 7095 Ivanpah Ave
- 7048 Quail Spring Ave
- 7096 Quail Spring Ave
- 7036 Quail Spring Ave
- 7042 Ivanpah Ave
- 7117 Ivanpah Ave
- 7009 Ivanpah Ave
- 616 Foothill 161-11 Dr
- 68955 Foothill Dr
- 122 Foothill Dr
- 8105 Foothill Dr
- 5 Foothill Dr
- 7110 Ivanpah Ave
- 7129 Ivanpah Ave
- 7003 Ivanpah Ave
- 7057 Quail Spring Ave
- 68927 Foothill Dr
- 7124 Ivanpah Ave