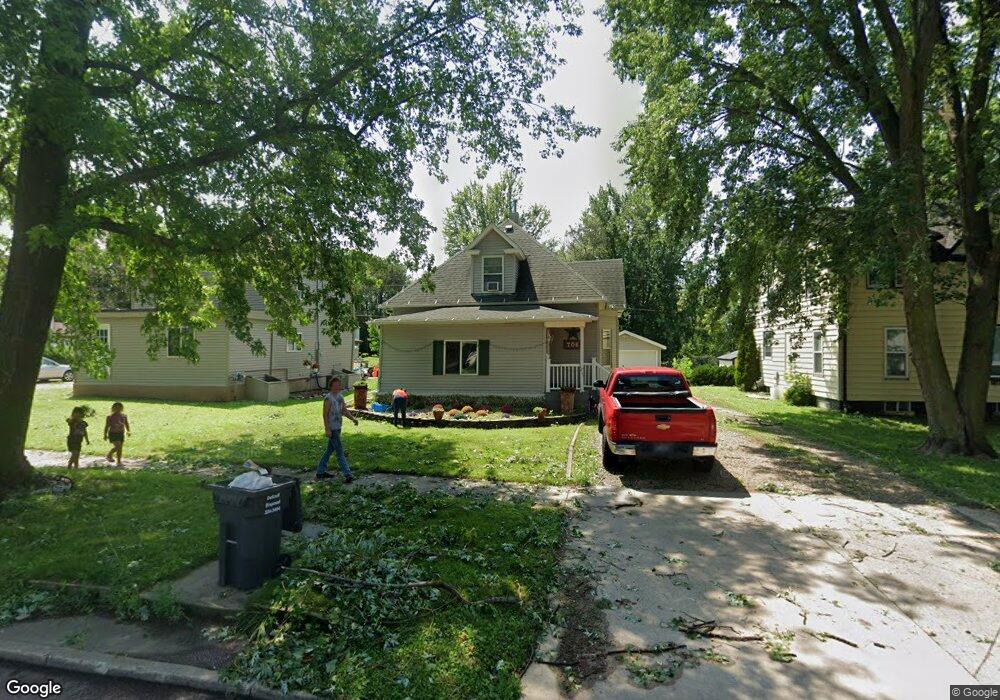
706 11 St Sheldon, IA 51201
Estimated Value: $120,000 - $190,000
3
Beds
2
Baths
1,649
Sq Ft
$97/Sq Ft
Est. Value
About This Home
This home is located at 706 11 St, Sheldon, IA 51201 and is currently estimated at $160,592, approximately $97 per square foot. 706 11 St is a home located in O'Brien County with nearby schools including East Elementary School, Sheldon Middle School, and Sheldon High School.
Ownership History
Date
Name
Owned For
Owner Type
Purchase Details
Closed on
Mar 22, 2023
Sold by
Culver Dawn
Bought by
Vasquez Franklin Rufino Perez
Current Estimated Value
Home Financials for this Owner
Home Financials are based on the most recent Mortgage that was taken out on this home.
Original Mortgage
$151,515
Outstanding Balance
$146,750
Interest Rate
6.12%
Mortgage Type
New Conventional
Estimated Equity
$13,842
Purchase Details
Closed on
Feb 28, 2022
Sold by
Boogerd Daryl L and Boogerd Sherri L
Bought by
Culver Dawn R
Create a Home Valuation Report for This Property
The Home Valuation Report is an in-depth analysis detailing your home's value as well as a comparison with similar homes in the area
Home Values in the Area
Average Home Value in this Area
Purchase History
| Date | Buyer | Sale Price | Title Company |
|---|---|---|---|
| Vasquez Franklin Rufino Perez | $150,000 | -- | |
| Culver Dawn R | $125,000 | None Listed On Document |
Source: Public Records
Mortgage History
| Date | Status | Borrower | Loan Amount |
|---|---|---|---|
| Open | Vasquez Franklin Rufino Perez | $151,515 |
Source: Public Records
Tax History Compared to Growth
Tax History
| Year | Tax Paid | Tax Assessment Tax Assessment Total Assessment is a certain percentage of the fair market value that is determined by local assessors to be the total taxable value of land and additions on the property. | Land | Improvement |
|---|---|---|---|---|
| 2025 | $2,062 | $149,830 | $18,230 | $131,600 |
| 2024 | $2,062 | $125,130 | $16,270 | $108,860 |
| 2023 | $2,018 | $125,130 | $16,270 | $108,860 |
| 2022 | $1,424 | $89,650 | $14,030 | $75,620 |
| 2021 | $1,424 | $89,650 | $14,030 | $75,620 |
| 2020 | $1,280 | $79,160 | $7,850 | $71,310 |
| 2019 | $1,260 | $75,930 | $0 | $0 |
| 2018 | $1,176 | $75,930 | $0 | $0 |
| 2017 | $1,316 | $76,130 | $0 | $0 |
| 2016 | $1,326 | $76,130 | $0 | $0 |
| 2015 | $1,326 | $74,210 | $0 | $0 |
| 2014 | $1,296 | $74,210 | $0 | $0 |
Source: Public Records
Map
Nearby Homes