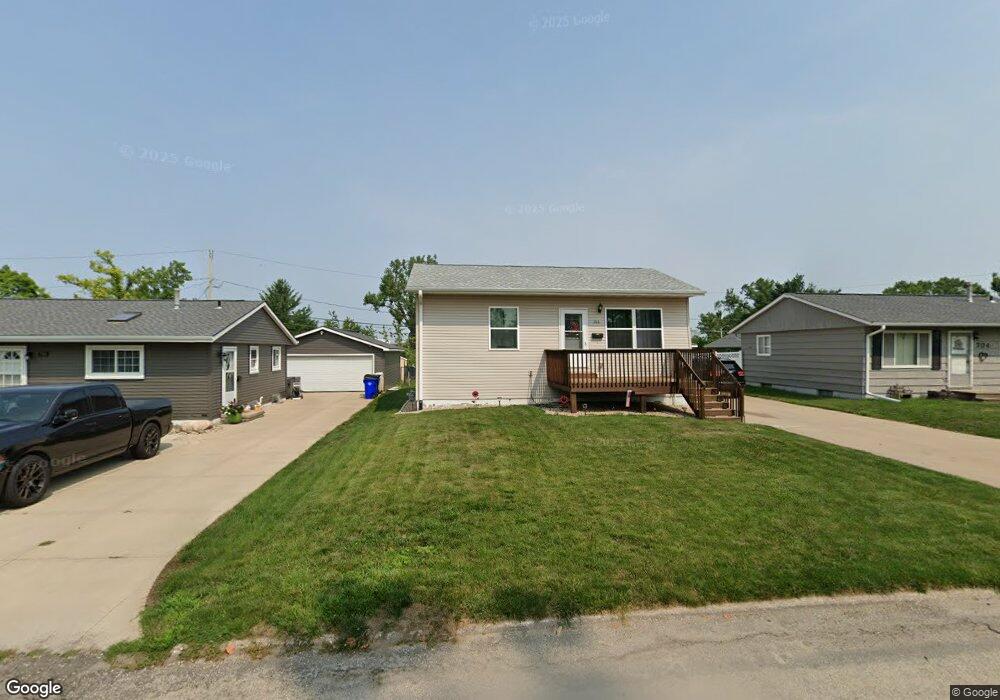
706 Danbury St NE Cedar Rapids, IA 52402
Noelridge Park NeighborhoodEstimated Value: $170,000 - $220,000
2
Beds
1
Bath
1,120
Sq Ft
$177/Sq Ft
Est. Value
About This Home
This home is located at 706 Danbury St NE, Cedar Rapids, IA 52402 and is currently estimated at $198,784, approximately $177 per square foot. 706 Danbury St NE is a home located in Linn County with nearby schools including Kenwood Leadership Academy, Cannonsburg Elementary School, and Franklin Middle School.
Ownership History
Date
Name
Owned For
Owner Type
Purchase Details
Closed on
Aug 26, 2014
Sold by
Hettinger Dwight C
Bought by
Dursky Blake J and Dursky Shayla R
Current Estimated Value
Home Financials for this Owner
Home Financials are based on the most recent Mortgage that was taken out on this home.
Original Mortgage
$29,000
Interest Rate
4.11%
Mortgage Type
Unknown
Purchase Details
Closed on
Nov 19, 2013
Sold by
Harris Leland A and Wikoff Brooke D
Bought by
Hettinger Dwight C
Purchase Details
Closed on
Aug 25, 2006
Sold by
Trobaugh Jane Lynn
Bought by
Harris Leland J and Wikoff Brooke D
Home Financials for this Owner
Home Financials are based on the most recent Mortgage that was taken out on this home.
Original Mortgage
$81,600
Interest Rate
6.78%
Mortgage Type
Unknown
Purchase Details
Closed on
Jan 30, 2006
Sold by
Trobaugh Charles Arnold
Bought by
Trobaugh Jane Lynn
Purchase Details
Closed on
Aug 18, 1998
Sold by
Haughenbury Richard T and Haughenbury Margaret T
Bought by
Franson Kenneth C and Franson Arloa L
Create a Home Valuation Report for This Property
The Home Valuation Report is an in-depth analysis detailing your home's value as well as a comparison with similar homes in the area
Home Values in the Area
Average Home Value in this Area
Purchase History
| Date | Buyer | Sale Price | Title Company |
|---|---|---|---|
| Dursky Blake J | $147,500 | None Available | |
| Hettinger Dwight C | $20,000 | None Available | |
| Harris Leland J | $101,500 | None Available | |
| Trobaugh Jane Lynn | -- | None Available | |
| Franson Kenneth C | -- | -- |
Source: Public Records
Mortgage History
| Date | Status | Borrower | Loan Amount |
|---|---|---|---|
| Closed | Dursky Blake J | $29,000 | |
| Previous Owner | Harris Leland J | $81,600 |
Source: Public Records
Tax History Compared to Growth
Tax History
| Year | Tax Paid | Tax Assessment Tax Assessment Total Assessment is a certain percentage of the fair market value that is determined by local assessors to be the total taxable value of land and additions on the property. | Land | Improvement |
|---|---|---|---|---|
| 2025 | $3,124 | $201,500 | $31,800 | $169,700 |
| 2024 | $3,298 | $191,500 | $31,800 | $159,700 |
| 2023 | $3,298 | $176,500 | $27,400 | $149,100 |
| 2022 | $3,124 | $156,400 | $27,400 | $129,000 |
| 2021 | $3,414 | $150,800 | $23,100 | $127,700 |
| 2020 | $3,414 | $154,700 | $23,100 | $131,600 |
| 2019 | $3,058 | $141,900 | $23,100 | $118,800 |
| 2018 | $2,974 | $141,900 | $23,100 | $118,800 |
| 2017 | $2,884 | $135,700 | $23,100 | $112,600 |
| 2016 | $2,884 | $135,700 | $23,100 | $112,600 |
| 2015 | $754 | $35,427 | $28,875 | $6,552 |
| 2014 | $754 | $42,822 | $28,875 | $13,947 |
| 2013 | $446 | $42,822 | $28,875 | $13,947 |
Source: Public Records
Map
Nearby Homes
- 0 C Ave NE
- 1048 Clifton St NE
- 143 40th St NE
- 410 41st St NE
- 5703 Golden Ct NE Unit 34
- 3724 F Ave NE
- 530 37th St NE
- 5712 Golden Ct NE Unit 60
- 5794 Oakwood Ave NE Unit 2
- 3718 C Ave NE
- 1231 Miami Ct NE
- 115 Dawley St NE
- 4309 Benton St NE
- 800 35th St NE
- 1006 Messina Dr NE
- 1138 Messina Dr NE
- 431 Teakwood Ln NE
- 1114 35th St NE
- 327 Meadows Field Dr NE
- 3630 Oakland Rd NE
- 704 Danbury St NE
- 708 Danbury St NE
- 4403 Lee St NE
- 702 Danbury St NE
- 710 Danbury St NE
- 4405 Lee St NE
- 709 Gateway St NE
- 715 Gateway St NE
- 707 Danbury St NE
- 705 Danbury St NE
- 700 Danbury St NE
- 709 Danbury St NE
- 705 Gateway St NE
- 701 Danbury St NE
- 4407 Lee St NE
- 719 Gateway St NE
- 711 Danbury St NE
- 716 Danbury St NE
- 4612 F Ave NE
- 723 Gateway St NE