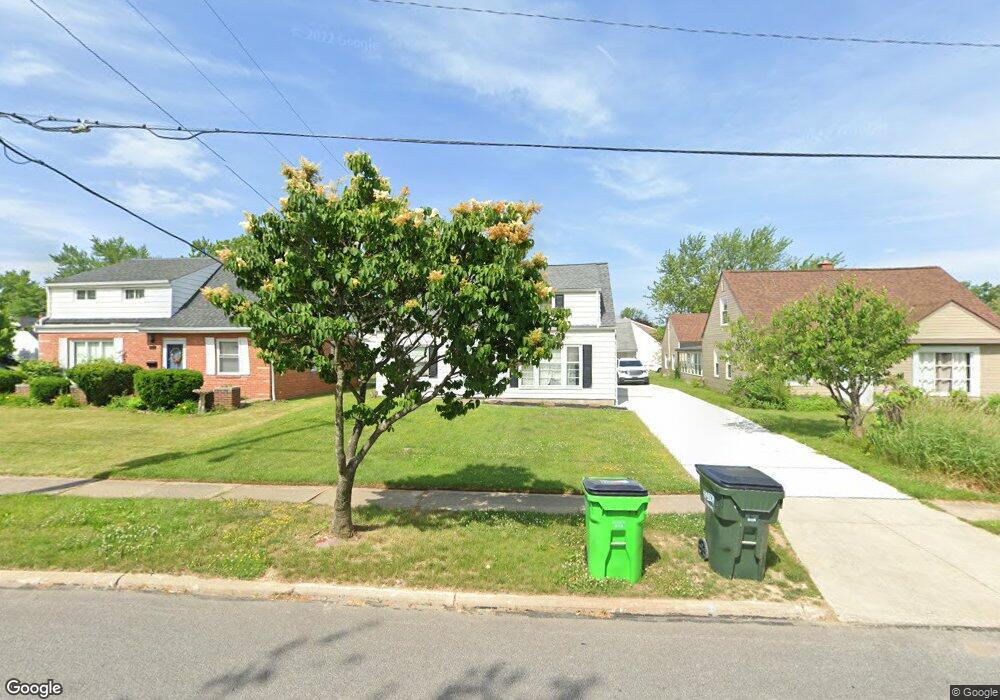
706 E 266th St Euclid, OH 44132
Estimated Value: $137,992 - $160,000
4
Beds
1
Bath
1,447
Sq Ft
$104/Sq Ft
Est. Value
About This Home
This home is located at 706 E 266th St, Euclid, OH 44132 and is currently estimated at $149,998, approximately $103 per square foot. 706 E 266th St is a home located in Cuyahoga County with nearby schools including Shoreview Elementary School, Euclid High School, and Ss Robert & William Catholic School.
Ownership History
Date
Name
Owned For
Owner Type
Purchase Details
Closed on
May 15, 2002
Sold by
Smolik Kirk and Smolik Eileen
Bought by
Brown Clyde R and Brown Dollinda P
Current Estimated Value
Home Financials for this Owner
Home Financials are based on the most recent Mortgage that was taken out on this home.
Original Mortgage
$90,578
Interest Rate
7.16%
Purchase Details
Closed on
Apr 20, 1998
Sold by
Smolic Kirk and Smolic Eileen
Bought by
Smolik Kirk and Smolik Eileen
Home Financials for this Owner
Home Financials are based on the most recent Mortgage that was taken out on this home.
Original Mortgage
$34,800
Interest Rate
7.26%
Purchase Details
Closed on
Oct 19, 1984
Sold by
Laurie Terrance M
Bought by
Smolic Kirk
Purchase Details
Closed on
Dec 2, 1980
Sold by
Laurie Anthony M and Laurie Helen C
Bought by
Laurie Helen C
Purchase Details
Closed on
Jan 1, 1975
Bought by
Laurie Anthony M and Laurie Helen C
Create a Home Valuation Report for This Property
The Home Valuation Report is an in-depth analysis detailing your home's value as well as a comparison with similar homes in the area
Home Values in the Area
Average Home Value in this Area
Purchase History
We collect this data history from publicly available records. To have your information removed, we recommend requesting removal directly through your county’s website.
| Date | Buyer | Sale Price | Title Company |
|---|---|---|---|
| Brown Clyde R | $92,000 | Midland Title Security Inc | |
| Smolik Kirk | -- | -- | |
| Smolic Kirk | $25,000 | -- | |
| Smolic Kirk | $26,500 | -- | |
| Laurie Terrance M | -- | -- | |
| Laurie Helen C | -- | -- | |
| Laurie Anthony M | -- | -- |
Source: Public Records
Mortgage History
We collect this data history from publicly available records. To have your information removed, we recommend requesting removal directly through your county’s website.
| Date | Status | Borrower | Loan Amount |
|---|---|---|---|
| Previous Owner | Brown Clyde R | $90,578 | |
| Previous Owner | Smolik Kirk | $34,800 |
Source: Public Records
Tax History
| Year | Tax Paid | Tax Assessment Tax Assessment Total Assessment is a certain percentage of the fair market value that is determined by local assessors to be the total taxable value of land and additions on the property. | Land | Improvement |
|---|---|---|---|---|
| 2025 | $2,559 | $38,010 | $9,415 | $28,595 |
| 2024 | $2,647 | $38,010 | $9,415 | $28,595 |
| 2023 | $2,657 | $30,590 | $7,140 | $23,450 |
| 2022 | $2,597 | $30,590 | $7,140 | $23,450 |
| 2021 | $2,892 | $30,590 | $7,140 | $23,450 |
| 2020 | $2,745 | $26,390 | $6,160 | $20,230 |
| 2019 | $2,467 | $75,400 | $17,600 | $57,800 |
| 2018 | $2,491 | $26,390 | $6,160 | $20,230 |
| 2017 | $2,614 | $23,140 | $5,110 | $18,030 |
| 2016 | $2,620 | $23,140 | $5,110 | $18,030 |
| 2015 | $2,385 | $23,140 | $5,110 | $18,030 |
| 2014 | $2,385 | $23,140 | $5,110 | $18,030 |
Source: Public Records
Map
Nearby Homes
- 26361 Elinore Ave
- 26530 Shoreview Ave
- 610 E 266th St
- 26831 Shoreview Ave
- 754 Hemlock Dr
- 25671 Farringdon Ave
- 27182 Oriole Ave
- 25600 Zeman Ave
- 25650 Richards Ave
- 25370 Drakefield Ave
- 25401 Farringdon Ave
- 670 Walnut Dr
- 355 E 257th St
- 25101 Farringdon Ave
- 420 E 271st St
- 25151 Zeman Ave
- 325 E 257th St
- 25591 Forestview Ave
- 599 E 250th St
- 464 E 250th St
- 702 E 266th St
- 26521 Drakefield Ave
- 716 E 266th St
- 26500 Shirley Ave
- 26501 Drakefield Ave
- 26490 Shirley Ave
- 694 E 266th St
- 26491 Drakefield Ave
- 705 E 266th St
- 711 E 266th St
- 701 E 266th St
- 26480 Shirley Ave
- 726 E 266th St
- 26501 Shirley Ave
- 715 E 266th St
- 688 E 266th St
- 695 E 266th St
- 26481 Drakefield Ave
- 26491 Shirley Ave
- 26500 Drakefield Ave
Your Personal Tour Guide
Ask me questions while you tour the home.