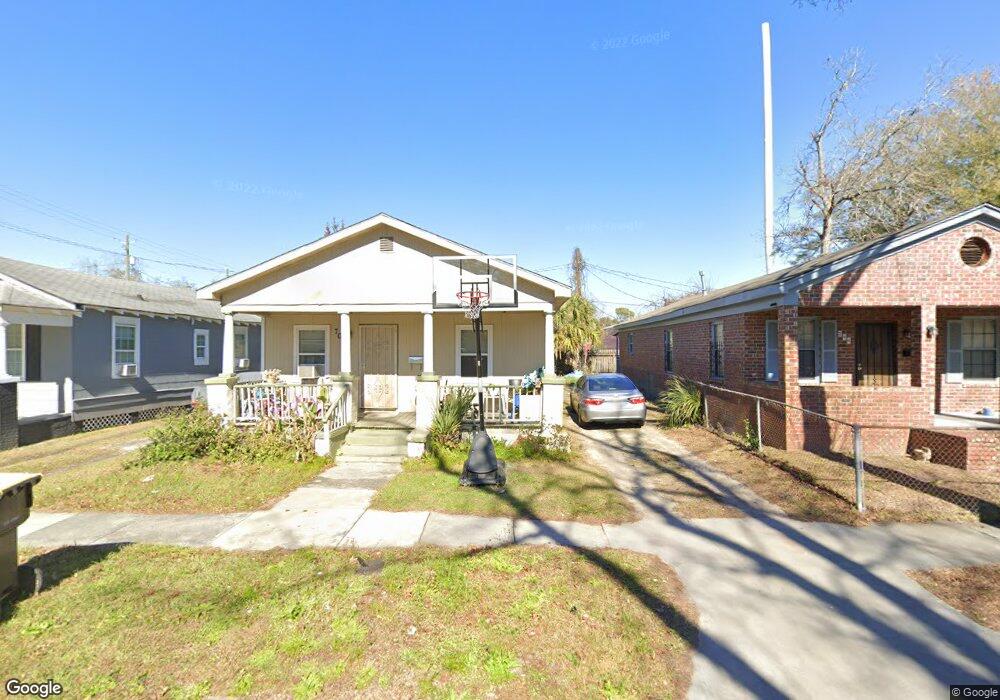
706 E 32nd St Savannah, GA 31401
Midtown Savannah NeighborhoodEstimated Value: $159,000 - $272,000
2
Beds
1
Bath
744
Sq Ft
$300/Sq Ft
Est. Value
About This Home
This home is located at 706 E 32nd St, Savannah, GA 31401 and is currently estimated at $222,985, approximately $299 per square foot. 706 E 32nd St is a home located in Chatham County with nearby schools including Shuman Elementary School, Hubert Middle School, and Savannah Arts Academy.
Ownership History
Date
Name
Owned For
Owner Type
Purchase Details
Closed on
Feb 3, 2009
Sold by
Not Provided
Bought by
Frazier Rachel L
Current Estimated Value
Home Financials for this Owner
Home Financials are based on the most recent Mortgage that was taken out on this home.
Original Mortgage
$62,067
Outstanding Balance
$38,829
Interest Rate
5.07%
Mortgage Type
FHA
Estimated Equity
$184,156
Purchase Details
Closed on
Feb 27, 2007
Sold by
Not Provided
Bought by
Frazier Rachel L
Create a Home Valuation Report for This Property
The Home Valuation Report is an in-depth analysis detailing your home's value as well as a comparison with similar homes in the area
Home Values in the Area
Average Home Value in this Area
Purchase History
| Date | Buyer | Sale Price | Title Company |
|---|---|---|---|
| Frazier Rachel L | $69,000 | -- | |
| Frazier Rachel L | $69,000 | -- | |
| Frazier Rachel L | $43,000 | -- |
Source: Public Records
Mortgage History
| Date | Status | Borrower | Loan Amount |
|---|---|---|---|
| Open | Frazier Rachel L | $62,067 | |
| Closed | Frazier Rachel L | $8,000 | |
| Closed | Frazier Rachel L | $62,067 |
Source: Public Records
Tax History
| Year | Tax Paid | Tax Assessment Tax Assessment Total Assessment is a certain percentage of the fair market value that is determined by local assessors to be the total taxable value of land and additions on the property. | Land | Improvement |
|---|---|---|---|---|
| 2025 | $299 | $67,120 | $28,000 | $39,120 |
| 2024 | $1 | $56,240 | $28,000 | $28,240 |
| 2023 | $218 | $40,240 | $15,000 | $25,240 |
| 2022 | $170 | $37,760 | $15,000 | $22,760 |
| 2021 | $539 | $26,080 | $6,000 | $20,080 |
| 2020 | $96 | $19,560 | $6,000 | $13,560 |
| 2019 | $347 | $19,560 | $6,000 | $13,560 |
| 2018 | $61 | $16,840 | $6,000 | $10,840 |
| 2017 | $144 | $11,560 | $5,160 | $6,400 |
| 2016 | $136 | $10,920 | $5,160 | $5,760 |
| 2015 | $124 | $9,920 | $5,160 | $4,760 |
| 2014 | $112 | $8,920 | $0 | $0 |
Source: Public Records
Map
Nearby Homes
Your Personal Tour Guide
Ask me questions while you tour the home.