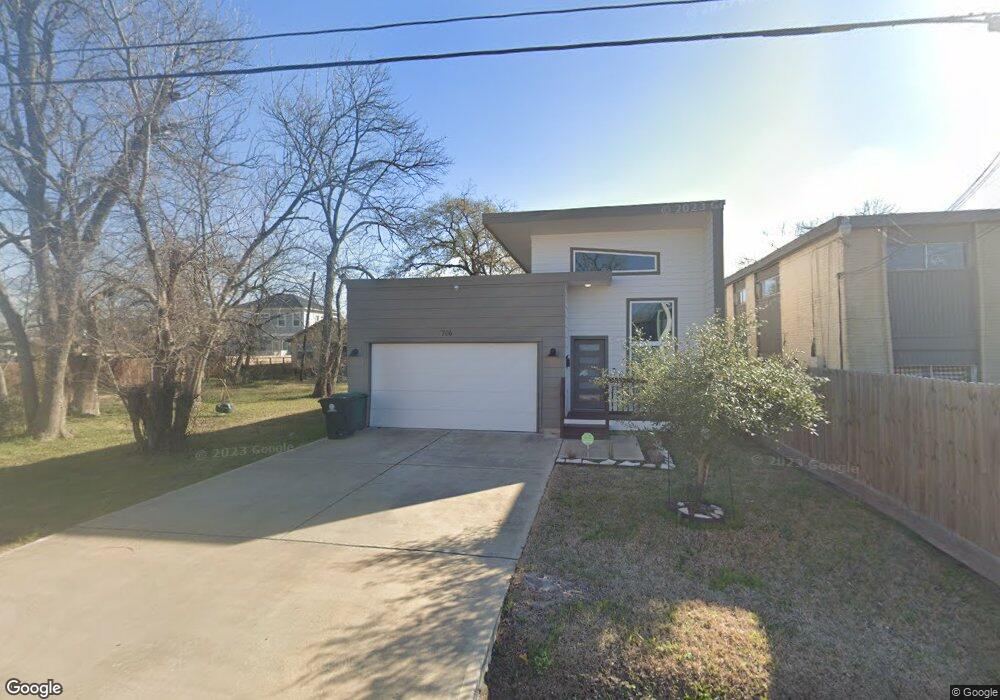
706 E 39th St Houston, TX 77022
Independence Heights NeighborhoodEstimated Value: $362,000 - $407,000
About This Home
This home is located at 706 E 39th St, Houston, TX 77022 and is currently estimated at $378,492, approximately $226 per square foot. 706 E 39th St is a home with nearby schools including Burrus Elementary School, Williams Middle, and Booker T Washington Sr High.
Ownership History
We collect this data history from publicly available records. To have your information removed, we recommend requesting removal directly through your county’s website.
Purchase Details
Purchase Details
Home Financials for this Owner
Home Financials are based on the most recent Mortgage that was taken out on this home.Purchase Details
Purchase Details
Home Values in the Area
Average Home Value in this Area
Purchase History
We collect this data history from publicly available records. To have your information removed, we recommend requesting removal directly through your county’s website.
| Date | Buyer | Sale Price | Title Company |
|---|---|---|---|
| -- | None Listed On Document | ||
| -- | Metropolitan Escrow & Title | ||
| -- | Stewart Title Houston Div | ||
| -- | None Available |
Mortgage History
We collect this data history from publicly available records. To have your information removed, we recommend requesting removal directly through your county’s website.
| Date | Status | Borrower | Loan Amount |
|---|---|---|---|
| Previous Owner | $205,640 |
Tax History
We collect this data history from publicly available records. To have your information removed, we recommend requesting removal directly through your county’s website.
| Year | Tax Paid | Tax Assessment Tax Assessment Total Assessment is a certain percentage of the fair market value that is determined by local assessors to be the total taxable value of land and additions on the property. | Land | Improvement |
|---|---|---|---|---|
| 2025 | $8,576 | $403,540 | $112,000 | $291,540 |
| 2024 | $8,242 | $393,888 | $112,000 | $281,888 |
| 2023 | $8,242 | $383,889 | $112,000 | $271,889 |
| 2022 | $7,479 | $339,645 | $96,000 | $243,645 |
| 2021 | $7,055 | $302,691 | $80,000 | $222,691 |
| 2020 | $6,849 | $282,815 | $80,000 | $202,815 |
| 2019 | $1,771 | $70,000 | $70,000 | $0 |
| 2018 | $1,215 | $48,000 | $48,000 | $0 |
| 2017 | $910 | $0 | $0 | $0 |
| 2016 | $0 | $0 | $0 | $0 |
| 2015 | -- | $0 | $0 | $0 |
| 2014 | -- | $16,000 | $16,000 | $0 |
Map
- 3914 Ajax St
- 728 E 38th St
- 727 E 37th St
- 723 E 37th St
- 1010 E 38th St
- 725 E 37th St
- 806 E 39th St Unit A
- 806 E 39th St
- 804 E 39th St
- 3504 & 0 Cornell St
- 719 E 40th 1/2 St
- 806 E 38th St
- 523 E 39th St
- 629 E 37th St
- 810 E 39th St
- 809 E 40th St
- 816 E 38th St Unit C
- 4028 Cornell St
- 507 E 38th St
- 805 E 36th St
Ask me questions while you tour the home.