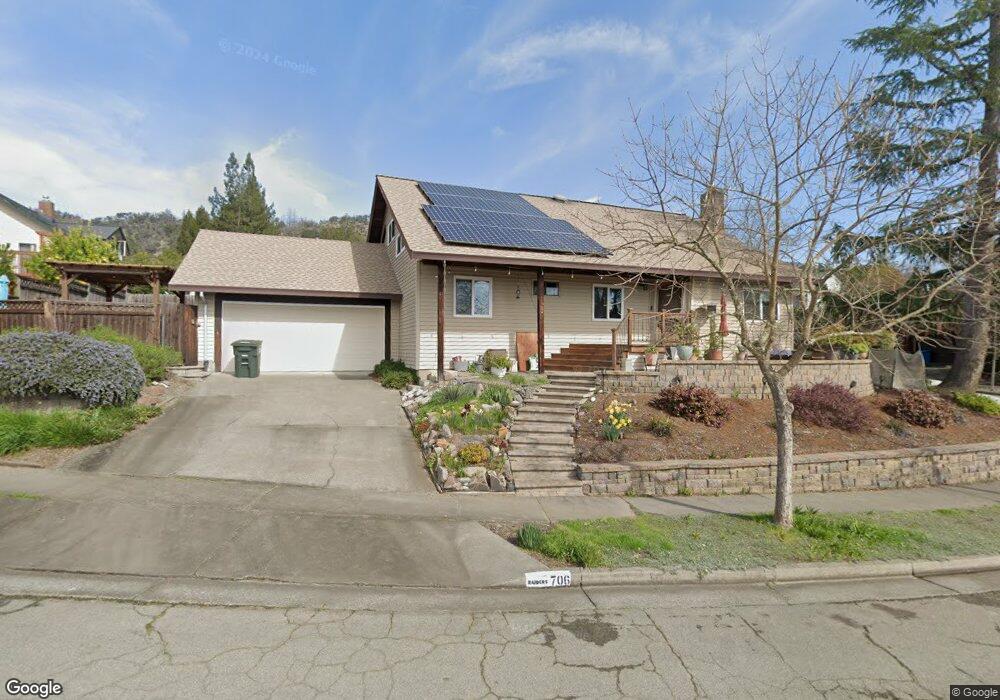
706 Hillmont St Santa Rosa, CA 95409
Skyhawk NeighborhoodEstimated Value: $792,000 - $1,058,000
3
Beds
2
Baths
2,593
Sq Ft
$359/Sq Ft
Est. Value
About This Home
This home is located at 706 Hillmont St, Santa Rosa, CA 95409 and is currently estimated at $929,816, approximately $358 per square foot. 706 Hillmont St is a home located in Sonoma County with nearby schools including Sequoia Elementary School, Rincon Valley Middle School, and Maria Carrillo High School.
Ownership History
Date
Name
Owned For
Owner Type
Purchase Details
Closed on
Mar 26, 2025
Sold by
Bratsberg Sharyn F and Enochs Robert C
Bought by
Robert C Enochs And Sharyn F Bratsberg Trust and Enochs
Current Estimated Value
Purchase Details
Closed on
Aug 25, 2005
Sold by
Bratsberg Sharyn F
Bought by
Enochs Robert C and Bratsberg Sharyn F
Home Financials for this Owner
Home Financials are based on the most recent Mortgage that was taken out on this home.
Original Mortgage
$359,650
Interest Rate
5.64%
Mortgage Type
New Conventional
Purchase Details
Closed on
Dec 12, 2001
Sold by
Bratsberg Sharyn and Bratsberg Sharyn F
Bought by
Bratsberg Sharyn F
Home Financials for this Owner
Home Financials are based on the most recent Mortgage that was taken out on this home.
Original Mortgage
$300,000
Interest Rate
6.57%
Purchase Details
Closed on
Jul 23, 1996
Sold by
Bratsberg George
Bought by
Bratsberg Sharyn
Create a Home Valuation Report for This Property
The Home Valuation Report is an in-depth analysis detailing your home's value as well as a comparison with similar homes in the area
Home Values in the Area
Average Home Value in this Area
Purchase History
| Date | Buyer | Sale Price | Title Company |
|---|---|---|---|
| Robert C Enochs And Sharyn F Bratsberg Trust | -- | None Listed On Document | |
| Enochs Robert C | -- | First American Title Co | |
| Bratsberg Sharyn F | -- | Sonoma Title Guaranty Compan | |
| Bratsberg Sharyn | -- | Sonoma Title Guaranty Compan | |
| Bratsberg Sharyn | -- | -- |
Source: Public Records
Mortgage History
| Date | Status | Borrower | Loan Amount |
|---|---|---|---|
| Previous Owner | Enochs Robert C | $359,650 | |
| Previous Owner | Bratsberg Sharyn | $300,000 |
Source: Public Records
Tax History Compared to Growth
Tax History
| Year | Tax Paid | Tax Assessment Tax Assessment Total Assessment is a certain percentage of the fair market value that is determined by local assessors to be the total taxable value of land and additions on the property. | Land | Improvement |
|---|---|---|---|---|
| 2025 | $3,546 | $304,552 | $97,605 | $206,947 |
| 2024 | $3,546 | $298,582 | $95,692 | $202,890 |
| 2023 | $3,546 | $292,728 | $93,816 | $198,912 |
| 2022 | $3,274 | $286,989 | $91,977 | $195,012 |
| 2021 | $3,208 | $281,363 | $90,174 | $191,189 |
| 2020 | $3,196 | $278,479 | $89,250 | $189,229 |
| 2019 | $3,164 | $273,019 | $87,500 | $185,519 |
| 2018 | $3,142 | $267,667 | $85,785 | $181,882 |
| 2017 | $3,083 | $262,419 | $84,103 | $178,316 |
| 2016 | $3,043 | $257,274 | $82,454 | $174,820 |
| 2015 | $2,952 | $253,411 | $81,216 | $172,195 |
| 2014 | $2,844 | $248,448 | $79,626 | $168,822 |
Source: Public Records
Map
Nearby Homes
- 5209 San Luis Ave
- 29 Coronado Cir
- 31 Springhill Ct
- 66 Coronado Cir
- 28 Springhill Ct
- 5243 Beaumont Way
- 61 Coronado Cir
- 48 Shadyleaf Ct
- 71 Oakcreek Ct
- 537 Emerald Park Ct
- 52 Oakstone Ct Unit 52
- 164 Brookview Ct
- 103 Glenoak Ct
- 305 Simone Place N
- 5518 Marit Dr
- 311 Algiers Ct
- 5015 Charmian Dr
- 5086 Charmian Dr
- 184 El Encanto Way
- 5534 Rainbow Cir
- 5227 Piedmont Dr
- 718 Hillmont St
- 707 Hillmont St
- 711 Hillmont St
- 5231 Piedmont Dr
- 5220 Piedmont Dr
- 5211 Piedmont Dr
- 645 Crestmont Dr
- 728 Hillmont St
- 5216 Piedmont Dr
- 715 Hillmont St
- 5235 Piedmont Dr
- 719 Hillmont St
- 5212 Piedmont Dr
- 708 Montclair Dr
- 704 Montclair Dr
- 664 Rinaldo St
- 660 Rinaldo St
- 736 Hillmont St
- 712 Montclair Dr