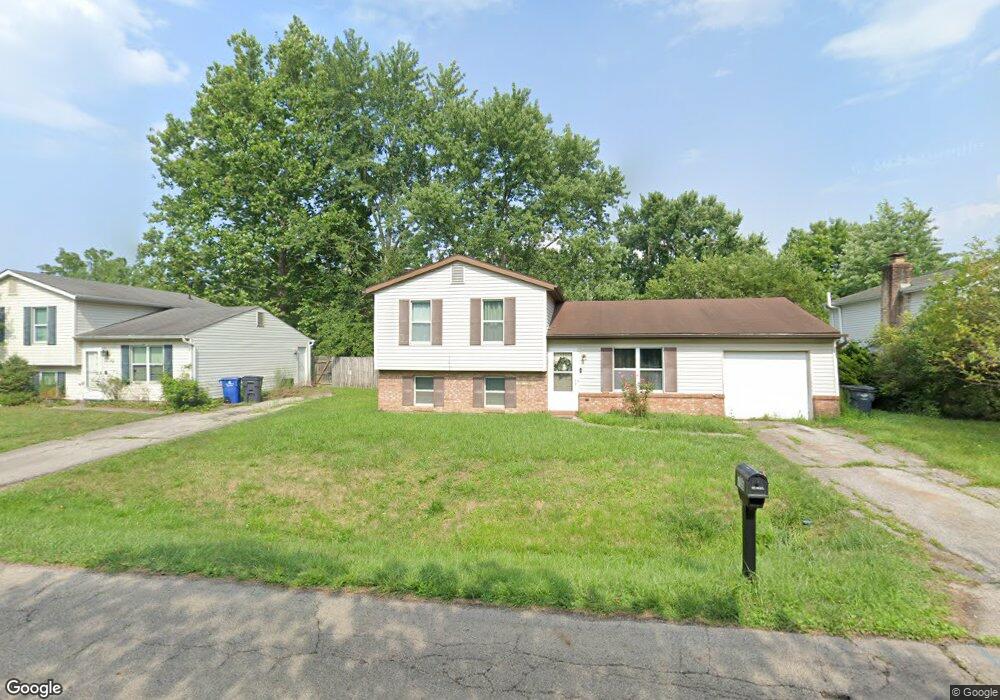
706 Hines Rd Columbus, OH 43230
Estimated Value: $222,000 - $289,078
3
Beds
2
Baths
1,346
Sq Ft
$201/Sq Ft
Est. Value
About This Home
This home is located at 706 Hines Rd, Columbus, OH 43230 and is currently estimated at $270,770, approximately $201 per square foot. 706 Hines Rd is a home located in Franklin County with nearby schools including Royal Manor Elementary School, Gahanna West Middle School, and Lincoln High School.
Ownership History
Date
Name
Owned For
Owner Type
Purchase Details
Closed on
Nov 27, 2018
Bought by
Airmer Llc
Current Estimated Value
Purchase Details
Closed on
Dec 20, 2017
Sold by
Levine Deborah A
Bought by
Deutchman Charles S and Debbie Levine Trusts
Purchase Details
Closed on
Sep 6, 2017
Sold by
Levine Deborah A
Bought by
Levine Deborah A and The Debbie Levine Trusts
Purchase Details
Closed on
Feb 12, 2004
Sold by
Winderl Kathleen S
Bought by
Levine Deborah A
Purchase Details
Closed on
Feb 6, 2004
Sold by
Park National Bank
Bought by
Winderl Kathleen S
Purchase Details
Closed on
May 29, 1984
Bought by
Winderl Edward J
Purchase Details
Closed on
Dec 1, 1980
Create a Home Valuation Report for This Property
The Home Valuation Report is an in-depth analysis detailing your home's value as well as a comparison with similar homes in the area
Purchase History
| Date | Buyer | Sale Price | Title Company |
|---|---|---|---|
| Airmer Llc | -- | -- | |
| Deutchman Charles S | -- | None Available | |
| Levine Deborah A | -- | None Available | |
| Levine Deborah A | $92,200 | Gahanna Title | |
| Winderl Kathleen S | -- | -- | |
| Winderl Edward J | $48,000 | -- | |
| -- | $45,000 | -- |
Source: Public Records
Tax History
| Year | Tax Paid | Tax Assessment Tax Assessment Total Assessment is a certain percentage of the fair market value that is determined by local assessors to be the total taxable value of land and additions on the property. | Land | Improvement |
|---|---|---|---|---|
| 2025 | $4,870 | $81,030 | $26,250 | $54,780 |
| 2024 | $4,870 | $81,030 | $26,250 | $54,780 |
| 2023 | $4,810 | $81,025 | $26,250 | $54,775 |
| 2022 | $3,964 | $52,020 | $12,850 | $39,170 |
| 2021 | $3,837 | $52,020 | $12,850 | $39,170 |
| 2020 | $4,128 | $52,020 | $12,850 | $39,170 |
| 2019 | $3,196 | $43,440 | $10,710 | $32,730 |
| 2018 | $3,044 | $43,440 | $10,710 | $32,730 |
| 2017 | $2,940 | $43,440 | $10,710 | $32,730 |
| 2016 | $2,912 | $39,170 | $10,190 | $28,980 |
| 2015 | $2,914 | $39,170 | $10,190 | $28,980 |
| 2014 | $2,891 | $39,170 | $10,190 | $28,980 |
| 2013 | $1,437 | $39,165 | $10,185 | $28,980 |
Source: Public Records
Map
Nearby Homes
- 3877 Hines Rd
- 613 Mistletoe St
- 536 Springwood Lake Dr
- 830 Lindenhaven Rd
- 3455 Halpern St
- 475 Denwood Ct
- 427 Canfield Dr
- 424 Lincolnshire Rd
- 3555 Tami Place
- 4672 Sperry Ave
- 394 Banbury Dr
- 4125 Emerius Dr
- 395 Amesbury Dr
- 595 Deerwood Ave E
- 956 Crystal Cay Ct
- 420 Denwood Ct
- 388 Elkwood Place
- 371 Banbury Dr
- 362 Banbury Dr
- 586 Pinegrove Place
Your Personal Tour Guide
Ask me questions while you tour the home.