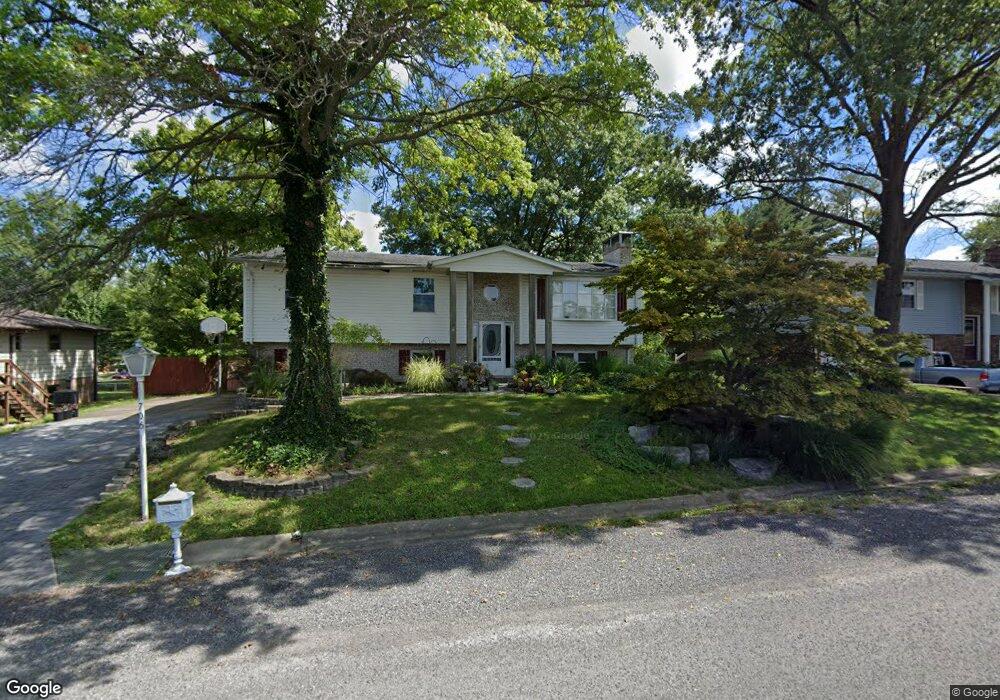
706 Lunch Rd Smithton, IL 62285
Estimated Value: $250,000 - $273,000
3
Beds
2
Baths
2,000
Sq Ft
$132/Sq Ft
Est. Value
About This Home
This home is located at 706 Lunch Rd, Smithton, IL 62285 and is currently estimated at $264,498, approximately $132 per square foot. 706 Lunch Rd is a home located in St. Clair County with nearby schools including Smithton Elementary, Freeburg Community High School, and St John the Baptist Catholic School.
Ownership History
Date
Name
Owned For
Owner Type
Purchase Details
Closed on
Dec 4, 2008
Sold by
Schwemmer Justin and Schwemmer Gabrielle
Bought by
Vanderleest Chad
Current Estimated Value
Home Financials for this Owner
Home Financials are based on the most recent Mortgage that was taken out on this home.
Original Mortgage
$138,740
Outstanding Balance
$91,268
Interest Rate
6.04%
Mortgage Type
Purchase Money Mortgage
Estimated Equity
$173,230
Purchase Details
Closed on
Jan 3, 2003
Sold by
Kohlberg Donna
Bought by
Schwemmer Justin and Schwemmer Gaberielle
Home Financials for this Owner
Home Financials are based on the most recent Mortgage that was taken out on this home.
Original Mortgage
$128,250
Interest Rate
6.13%
Create a Home Valuation Report for This Property
The Home Valuation Report is an in-depth analysis detailing your home's value as well as a comparison with similar homes in the area
Home Values in the Area
Average Home Value in this Area
Purchase History
| Date | Buyer | Sale Price | Title Company |
|---|---|---|---|
| Vanderleest Chad | $137,000 | Town & Country Title Co | |
| Schwemmer Justin | $142,500 | -- |
Source: Public Records
Mortgage History
| Date | Status | Borrower | Loan Amount |
|---|---|---|---|
| Open | Vanderleest Chad | $138,740 | |
| Previous Owner | Schwemmer Justin | $128,250 |
Source: Public Records
Tax History Compared to Growth
Tax History
| Year | Tax Paid | Tax Assessment Tax Assessment Total Assessment is a certain percentage of the fair market value that is determined by local assessors to be the total taxable value of land and additions on the property. | Land | Improvement |
|---|---|---|---|---|
| 2024 | $5,142 | $68,455 | $9,842 | $58,613 |
| 2023 | $4,868 | $63,626 | $9,148 | $54,478 |
| 2022 | $4,548 | $58,394 | $8,396 | $49,998 |
| 2021 | $4,341 | $54,986 | $7,906 | $47,080 |
| 2020 | $4,264 | $51,770 | $7,627 | $44,143 |
| 2019 | $4,101 | $51,770 | $7,627 | $44,143 |
| 2018 | $3,908 | $49,957 | $7,360 | $42,597 |
| 2017 | $3,804 | $47,642 | $7,019 | $40,623 |
| 2016 | $3,819 | $46,526 | $7,141 | $39,385 |
| 2014 | $3,343 | $45,784 | $7,027 | $38,757 |
| 2013 | $3,482 | $46,780 | $7,180 | $39,600 |
Source: Public Records
Map
Nearby Homes
- 309 Sunset Dr
- 14 N High St
- 408 S Smith St
- 5548 High St
- 5433 Kraft Rd
- 4525 Boardwalk
- 4517 Boardwalk
- 4916 Wilderness Pointe
- 4901 Wilderness Point
- TBB Kraft Rd
- 3402 Arbor View Ct
- 5248 Cherry Oak Ln
- 0 Unknown Unit 22065045
- 4220 Knab Rd
- 000 Etling Rd
- 00 Etling Rd
- 4173 Water Oak Ln
- 4057 Bur Oak Dr
- 4132 Tbb Summer Oak Rd
- 4122 Knab Rd