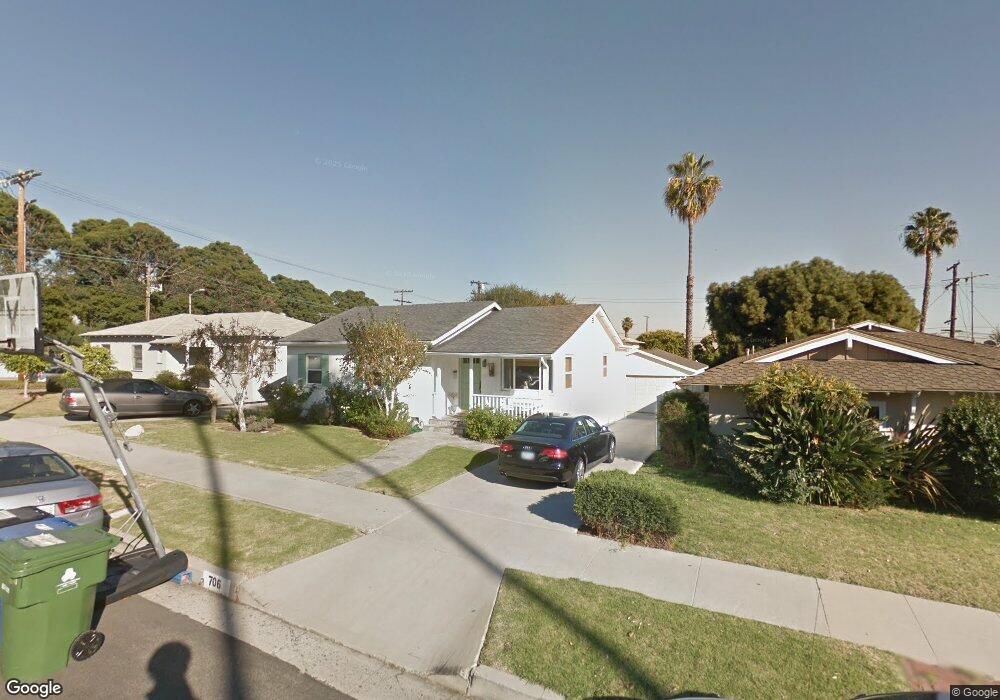
706 S Ellery Dr San Pedro, CA 90732
Estimated Value: $1,046,563 - $1,220,000
3
Beds
2
Baths
1,700
Sq Ft
$687/Sq Ft
Est. Value
About This Home
This home is located at 706 S Ellery Dr, San Pedro, CA 90732 and is currently estimated at $1,167,891, approximately $686 per square foot. 706 S Ellery Dr is a home located in Los Angeles County with nearby schools including Seventh Street Elementary School, Dana Middle School, and San Pedro Senior High School.
Ownership History
Date
Name
Owned For
Owner Type
Purchase Details
Closed on
Feb 20, 2020
Sold by
Butorovich Tracy
Bought by
Butorovich Tony and Butorovich Tracy
Current Estimated Value
Home Financials for this Owner
Home Financials are based on the most recent Mortgage that was taken out on this home.
Original Mortgage
$410,000
Outstanding Balance
$363,026
Interest Rate
3.6%
Mortgage Type
New Conventional
Estimated Equity
$804,865
Purchase Details
Closed on
Jun 26, 1998
Sold by
Walker Brett
Bought by
Freitas Allan B and Freitas Tracy L
Home Financials for this Owner
Home Financials are based on the most recent Mortgage that was taken out on this home.
Original Mortgage
$255,200
Interest Rate
7.06%
Create a Home Valuation Report for This Property
The Home Valuation Report is an in-depth analysis detailing your home's value as well as a comparison with similar homes in the area
Home Values in the Area
Average Home Value in this Area
Purchase History
| Date | Buyer | Sale Price | Title Company |
|---|---|---|---|
| Butorovich Tony | -- | Chicago Title Company | |
| Butorovich Tracy | -- | Chicago Title Company | |
| Freitas Allan B | $319,000 | Fidelity National Title Ins |
Source: Public Records
Mortgage History
| Date | Status | Borrower | Loan Amount |
|---|---|---|---|
| Open | Butorovich Tony | $410,000 | |
| Closed | Freitas Allan B | $255,200 | |
| Closed | Freitas Allan B | $47,850 |
Source: Public Records
Tax History Compared to Growth
Tax History
| Year | Tax Paid | Tax Assessment Tax Assessment Total Assessment is a certain percentage of the fair market value that is determined by local assessors to be the total taxable value of land and additions on the property. | Land | Improvement |
|---|---|---|---|---|
| 2025 | $6,152 | $500,075 | $334,381 | $165,694 |
| 2024 | $6,152 | $490,271 | $327,825 | $162,446 |
| 2023 | $6,035 | $480,659 | $321,398 | $159,261 |
| 2022 | $5,759 | $471,236 | $315,097 | $156,139 |
| 2021 | $5,683 | $461,997 | $308,919 | $153,078 |
| 2020 | $5,736 | $457,261 | $305,752 | $151,509 |
| 2019 | $5,514 | $448,296 | $299,757 | $148,539 |
| 2018 | $5,411 | $439,507 | $293,880 | $145,627 |
| 2016 | $5,161 | $422,442 | $282,469 | $139,973 |
| 2015 | $5,086 | $416,098 | $278,227 | $137,871 |
| 2014 | $5,107 | $407,948 | $272,777 | $135,171 |
Source: Public Records
Map
Nearby Homes
- 1307 W 7th St Unit 8
- 1516 W 5th St
- 1767 W Chandeleur Dr
- 1260 W 9th St
- 1801 W Chandeleur Dr
- 1118 S Malgren Ave
- 1778 El Rey Rd
- 1100 S Patton Ave
- 662 Rapallo Ave
- 358 S Miraleste Dr Unit 333
- 330 S Miraleste Dr Unit 216
- 356 S Miraleste Dr Unit 327
- 340 S Miraleste Dr Unit 269
- 360 S Miraleste Dr Unit 341
- 27644 Grandview Way
- 27723 Grandview Way
- 1522 W 1st St
- 801 Oro Terrace
- 1623 W 14th St
- 1331 S Patton Ave
- 710 S Ellery Dr
- 702 S Ellery Dr
- 1511 W 7th St
- 716 S Ellery Dr
- 1507 W 7th St
- 711 S Weymouth Ave
- 722 S Ellery Dr
- 717 S Weymouth Ave
- 1501 W 7th St
- 721 S Weymouth Ave
- 711 S Ellery Dr
- 726 S Ellery Dr
- 1557 W 7th St
- 715 S Ellery Dr
- 727 S Weymouth Ave
- 721 S Ellery Dr
- 1561 W 7th St
- 730 S Ellery Dr
- 725 S Ellery Dr
- 801 S Weymouth Ave