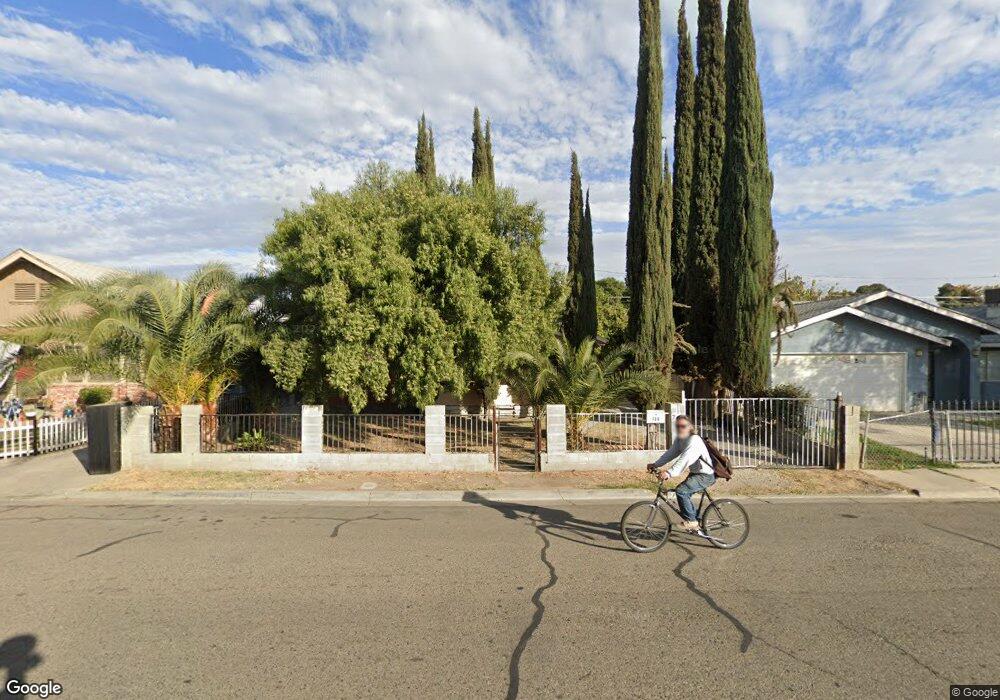
706 S Encina St Visalia, CA 93277
Washington NeighborhoodEstimated Value: $170,616 - $254,000
--
Bed
--
Bath
980
Sq Ft
$219/Sq Ft
Est. Value
About This Home
This home is located at 706 S Encina St, Visalia, CA 93277 and is currently estimated at $214,904, approximately $219 per square foot. 706 S Encina St is a home located in Tulare County with nearby schools including Washington Elementary School, Divisadero Middle School, and Mt. Whitney High School.
Ownership History
Date
Name
Owned For
Owner Type
Purchase Details
Closed on
Jan 8, 1996
Sold by
Royall Kevin D
Bought by
Cruz Jose Alejandro
Current Estimated Value
Home Financials for this Owner
Home Financials are based on the most recent Mortgage that was taken out on this home.
Original Mortgage
$47,955
Outstanding Balance
$1,275
Interest Rate
7.14%
Mortgage Type
FHA
Estimated Equity
$213,629
Purchase Details
Closed on
Nov 1, 1994
Sold by
Reyna Abraham
Bought by
Royall Kevin D and Royall Diane Y
Home Financials for this Owner
Home Financials are based on the most recent Mortgage that was taken out on this home.
Original Mortgage
$16,000
Interest Rate
8.86%
Mortgage Type
Seller Take Back
Purchase Details
Closed on
May 10, 1994
Sold by
Reyna Esther Rodriguez
Bought by
Reyna Abraham and Reyna Esther Rodriguez
Create a Home Valuation Report for This Property
The Home Valuation Report is an in-depth analysis detailing your home's value as well as a comparison with similar homes in the area
Home Values in the Area
Average Home Value in this Area
Purchase History
| Date | Buyer | Sale Price | Title Company |
|---|---|---|---|
| Cruz Jose Alejandro | $48,000 | Fidelity National Title | |
| Royall Kevin D | $26,000 | Old Republic Title Company | |
| Reyna Abraham | -- | -- |
Source: Public Records
Mortgage History
| Date | Status | Borrower | Loan Amount |
|---|---|---|---|
| Open | Cruz Jose Alejandro | $47,955 | |
| Previous Owner | Royall Kevin D | $16,000 |
Source: Public Records
Tax History Compared to Growth
Tax History
| Year | Tax Paid | Tax Assessment Tax Assessment Total Assessment is a certain percentage of the fair market value that is determined by local assessors to be the total taxable value of land and additions on the property. | Land | Improvement |
|---|---|---|---|---|
| 2025 | $775 | $79,739 | $46,513 | $33,226 |
| 2024 | $775 | $78,176 | $45,601 | $32,575 |
| 2023 | $752 | $76,644 | $44,707 | $31,937 |
| 2022 | $717 | $75,142 | $43,831 | $31,311 |
| 2021 | $717 | $73,669 | $42,972 | $30,697 |
| 2020 | $702 | $72,913 | $42,531 | $30,382 |
| 2019 | $689 | $71,483 | $41,697 | $29,786 |
| 2018 | $662 | $70,081 | $40,879 | $29,202 |
| 2017 | $662 | $68,706 | $40,077 | $28,629 |
| 2016 | $640 | $67,359 | $39,291 | $28,068 |
| 2015 | $619 | $66,347 | $38,701 | $27,646 |
| 2014 | $619 | $65,047 | $37,943 | $27,104 |
Source: Public Records
Map
Nearby Homes
- 526 W Myrtle Ave
- 433 S Church St
- 701 S Bridge St
- 439 S Bridge St Unit 5
- 602 S Conyer St
- 631 E Cypress Ave
- 542 W Paradise Ave
- 1315 S Conyer St
- 1107 W Westcott Ave
- 605 E Tulare Ave
- 733 W Paradise Ave
- 908 S Clark St
- 1737 S Bardo St
- 833 E Myrtle Ave
- 1812 S Bardo St
- 1301 W Beverly Dr
- 714 W Cambridge Ave
- 912 E Cypress Ave
- 904 S Bradley St
- 332 W Walnut Ave
- 704 S Encina St
- 708 S Encina St
- 702 S Encina St
- 710 S Encina St
- 715 S Locust St
- 719 S Locust St
- 712 S Encina St
- 711 S Locust St
- 721 S Locust St
- 707 S Encina St
- 701 S Encina St
- 700 S Encina St
- 709 S Locust St
- 709 S Encina St
- 703 S Encina St
- 723 S Locust St
- 711 S Encina St
- 705 S Locust St
- 713 S Encina St
- 725 S Locust St