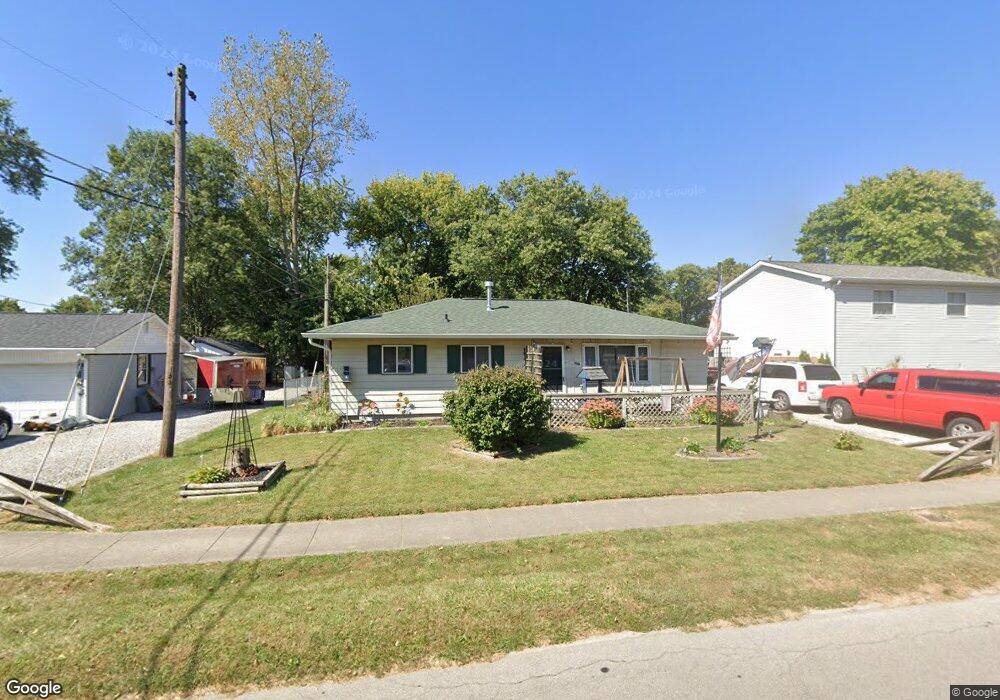
706 S Locust Ln Brownsburg, IN 46112
Estimated Value: $203,000 - $243,000
3
Beds
1
Bath
960
Sq Ft
$226/Sq Ft
Est. Value
About This Home
This home is located at 706 S Locust Ln, Brownsburg, IN 46112 and is currently estimated at $217,190, approximately $226 per square foot. 706 S Locust Ln is a home located in Hendricks County with nearby schools including Delaware Trail Elementary School, Brownsburg East Middle School, and Brownsburg High School.
Ownership History
Date
Name
Owned For
Owner Type
Purchase Details
Closed on
Jan 30, 2015
Sold by
Shoemaker Ronald E and Shoemaker Melissa B
Bought by
Spoon Robert A and Spoon Angela
Current Estimated Value
Home Financials for this Owner
Home Financials are based on the most recent Mortgage that was taken out on this home.
Original Mortgage
$76,415
Outstanding Balance
$60,036
Interest Rate
4.87%
Mortgage Type
FHA
Estimated Equity
$157,154
Purchase Details
Closed on
Jan 31, 2008
Sold by
Shoemaker Ronald E
Bought by
Shoemaker Ronald E and Shoemaker Melissa B
Home Financials for this Owner
Home Financials are based on the most recent Mortgage that was taken out on this home.
Original Mortgage
$75,650
Interest Rate
6.11%
Mortgage Type
New Conventional
Purchase Details
Closed on
Oct 2, 2007
Sold by
Secretary Of Hud and Jackson Alphonso
Bought by
Shoemaker Ronald E
Purchase Details
Closed on
Jan 18, 2007
Sold by
Chestnut Michael L and Chestnut Carla D
Bought by
Secretary Of Hud
Create a Home Valuation Report for This Property
The Home Valuation Report is an in-depth analysis detailing your home's value as well as a comparison with similar homes in the area
Home Values in the Area
Average Home Value in this Area
Purchase History
| Date | Buyer | Sale Price | Title Company |
|---|---|---|---|
| Spoon Robert A | -- | -- | |
| Shoemaker Ronald E | -- | None Available | |
| Shoemaker Ronald E | -- | None Available | |
| Secretary Of Hud | -- | None Available |
Source: Public Records
Mortgage History
| Date | Status | Borrower | Loan Amount |
|---|---|---|---|
| Open | Spoon Robert A | $76,415 | |
| Previous Owner | Shoemaker Ronald E | $75,650 |
Source: Public Records
Tax History
| Year | Tax Paid | Tax Assessment Tax Assessment Total Assessment is a certain percentage of the fair market value that is determined by local assessors to be the total taxable value of land and additions on the property. | Land | Improvement |
|---|---|---|---|---|
| 2025 | $1,503 | $156,100 | $30,800 | $125,300 |
| 2024 | $1,503 | $150,300 | $30,800 | $119,500 |
| 2023 | $1,427 | $138,100 | $28,000 | $110,100 |
| 2022 | $1,304 | $133,000 | $27,000 | $106,000 |
| 2021 | $1,153 | $117,800 | $25,500 | $92,300 |
| 2020 | $1,141 | $116,600 | $25,500 | $91,100 |
| 2019 | $1,047 | $110,600 | $24,200 | $86,400 |
| 2018 | $938 | $99,000 | $24,200 | $74,800 |
| 2017 | $919 | $97,300 | $23,200 | $74,100 |
| 2016 | $869 | $94,400 | $23,200 | $71,200 |
| 2014 | $1,758 | $87,900 | $23,500 | $64,400 |
| 2013 | $1,690 | $84,500 | $22,300 | $62,200 |
Source: Public Records
Map
Nearby Homes
- 154 Dover Blvd N
- 14 James Ct
- 6433 Wings Ct
- 506 S Green St
- 6415 Wings Ct
- 6338 Wings Ct
- 6750 E County Road 425 N
- 6 Kristelli Ct
- 212 Hamilton St
- 4475 Yellowwood Ave
- 4472 Yellowwood Ave
- 4494 Yellowwood Ave
- 6274 Chelsea St
- 4498 Yellowwood Ave
- 4502 Yellowwood Ave
- 4481 Yellowwood Ave
- 7643 Sagamore Dr
- 4508 Yellowwood Ave
- 6284 Chelsea St
- 6278 Chelsea St
- 203 W Joan Ave
- 708 S Locust Ln
- 207 W Joan Ave
- 211 W Joan Ave
- 710 S Locust Ln
- 206 Dover Rd
- 630 S Locust Ln
- 707 S Locust Ln
- 206 W Joan Ave
- 210 Dover Rd
- 215 W Joan Ave
- 701 S Locust Ln
- 150 Dover Blvd N
- 210 W Joan Ave
- 629 S Locust Ln
- 626 S Locust Ln
- 304 Dover Rd
- 219 W Joan Ave
- 549 S Alpha Ave
- 607 S Alpha Ave
Your Personal Tour Guide
Ask me questions while you tour the home.