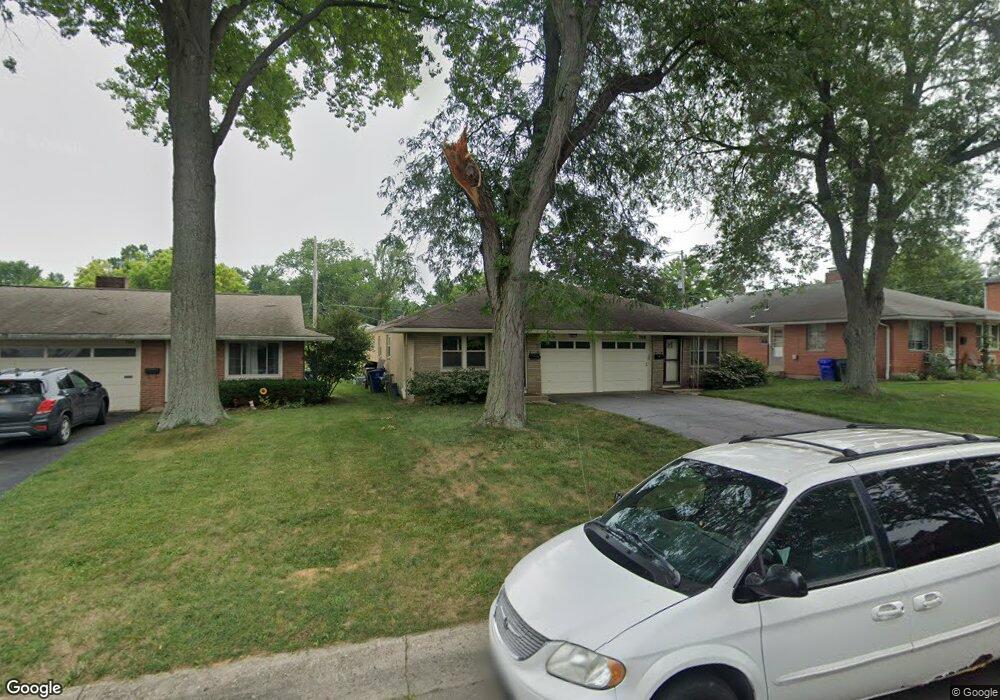
706 Springs Dr Unit 708 Columbus, OH 43214
Clintonville NeighborhoodEstimated Value: $321,000 - $416,905
4
Beds
2
Baths
1,664
Sq Ft
$216/Sq Ft
Est. Value
About This Home
This home is located at 706 Springs Dr Unit 708, Columbus, OH 43214 and is currently estimated at $359,726, approximately $216 per square foot. 706 Springs Dr Unit 708 is a home located in Franklin County with nearby schools including Colerain Elementary School, Dominion Middle School, and Whetstone High School.
Ownership History
Date
Name
Owned For
Owner Type
Purchase Details
Closed on
Apr 7, 2009
Sold by
Donovan Daniel P
Bought by
Donovan Daniel P and Daniel P Donovan Living Trust
Current Estimated Value
Purchase Details
Closed on
Mar 19, 1999
Sold by
Hall Russell A and Dillon Thomas H
Bought by
Donovan Daniel P
Home Financials for this Owner
Home Financials are based on the most recent Mortgage that was taken out on this home.
Original Mortgage
$145,706
Outstanding Balance
$32,532
Interest Rate
6.85%
Mortgage Type
FHA
Estimated Equity
$327,194
Purchase Details
Closed on
Jan 31, 1995
Sold by
Wymer Barbara J
Bought by
Hall Russell A and Dillon Thomas H
Home Financials for this Owner
Home Financials are based on the most recent Mortgage that was taken out on this home.
Original Mortgage
$82,950
Interest Rate
7.38%
Mortgage Type
New Conventional
Purchase Details
Closed on
Nov 1, 1985
Create a Home Valuation Report for This Property
The Home Valuation Report is an in-depth analysis detailing your home's value as well as a comparison with similar homes in the area
Home Values in the Area
Average Home Value in this Area
Purchase History
| Date | Buyer | Sale Price | Title Company |
|---|---|---|---|
| Donovan Daniel P | -- | Attorney | |
| Donovan Daniel P | $146,000 | Connor Title Co | |
| Hall Russell A | $118,500 | -- | |
| -- | -- | -- |
Source: Public Records
Mortgage History
| Date | Status | Borrower | Loan Amount |
|---|---|---|---|
| Open | Donovan Daniel P | $145,706 | |
| Previous Owner | Hall Russell A | $82,950 |
Source: Public Records
Tax History
| Year | Tax Paid | Tax Assessment Tax Assessment Total Assessment is a certain percentage of the fair market value that is determined by local assessors to be the total taxable value of land and additions on the property. | Land | Improvement |
|---|---|---|---|---|
| 2025 | $5,189 | $113,230 | $36,050 | $77,180 |
| 2024 | $5,189 | $113,230 | $36,050 | $77,180 |
| 2023 | $5,124 | $113,225 | $36,050 | $77,175 |
| 2022 | $4,710 | $88,630 | $30,070 | $58,560 |
| 2021 | $4,718 | $88,630 | $30,070 | $58,560 |
| 2020 | $4,726 | $88,630 | $30,070 | $58,560 |
| 2019 | $4,240 | $68,190 | $23,140 | $45,050 |
| 2018 | $4,081 | $68,190 | $23,140 | $45,050 |
| 2017 | $4,278 | $68,190 | $23,140 | $45,050 |
| 2016 | $4,316 | $63,530 | $18,590 | $44,940 |
| 2015 | $3,929 | $63,530 | $18,590 | $44,940 |
| 2014 | $3,939 | $63,530 | $18,590 | $44,940 |
| 2013 | $1,851 | $60,515 | $17,710 | $42,805 |
Source: Public Records
Map
Nearby Homes
- 702 E Weisheimer Rd
- 4299 Colerain Ave
- 827 Inwood Place
- 899 Meadowview Dr
- 389 Wetmore Rd
- 243 E Schreyer Place
- 601 Morse Rd
- 1130 Carbone Dr
- 440 Chatham Rd
- 350 E Beechwold Blvd
- 1144 Reed Circle Dr
- 374 Acton Rd
- 991 Hidden Acres Ct Unit 991
- 780 Moon Rd
- 531 Richards Rd
- 398 Fallis Rd
- 144 Wetmore Rd
- 528 Arden Rd
- 1046 Northridge Rd
- 82 Blenheim Rd
- 706 Springs Dr Unit 2
- 698 Springs Dr Unit 700
- 712 Springs Dr Unit 716
- 690 Springs Dr Unit 692
- 703 E Schreyer Place Unit 705
- 711 E Schreyer Place Unit 713
- 703-705 E Schreyer Place
- 695 E Schreyer Place Unit 697
- 4267 Indianola Ave
- 705 Springs Dr Unit 707
- 697 Springs Dr Unit 699
- 705-707 Springs Dr
- 687-689 E Schreyer Place
- 687 E Schreyer Place Unit 689
- 713 Springs Dr Unit 719
- 689 Springs Dr Unit 691
- 689-691 Springs Dr
- 4298 Eastlea Dr Unit 300
- 723 Springs Dr Unit 727
- 700 Village Dr Unit 702
Your Personal Tour Guide
Ask me questions while you tour the home.