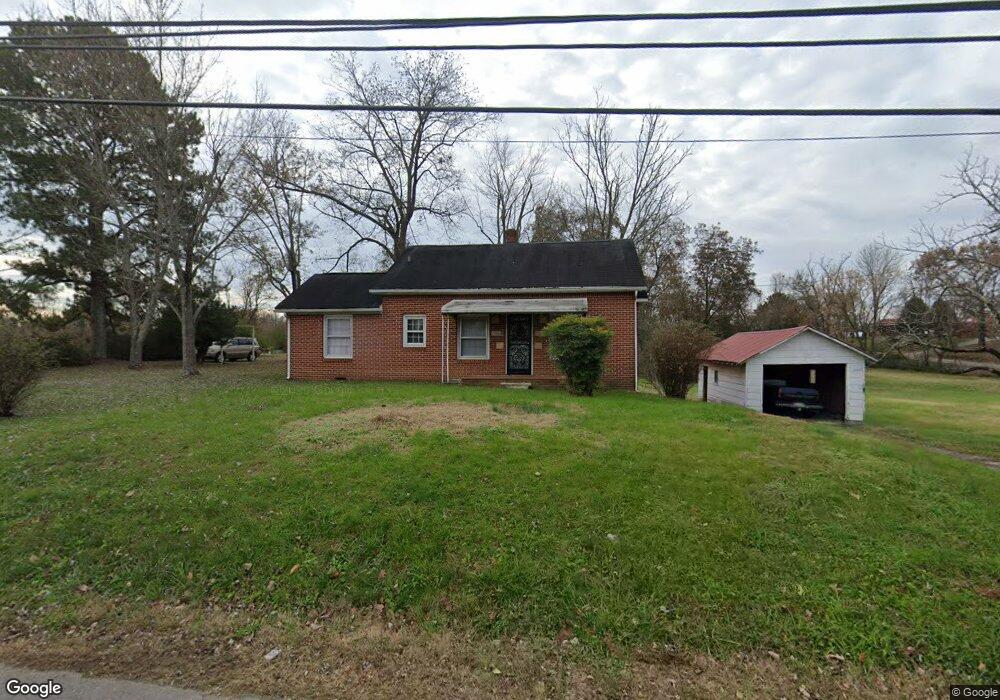
706 W Broad St Cookeville, TN 38501
Estimated Value: $236,000 - $249,000
--
Bed
1
Bath
1,296
Sq Ft
$186/Sq Ft
Est. Value
About This Home
This home is located at 706 W Broad St, Cookeville, TN 38501 and is currently estimated at $240,466, approximately $185 per square foot. 706 W Broad St is a home located in Putnam County with nearby schools including Cane Creek Elementary School, Upperman Middle School, and Upperman High School.
Ownership History
Date
Name
Owned For
Owner Type
Purchase Details
Closed on
Nov 1, 2024
Sold by
Rippetoe Toby C and Roland Sandra
Bought by
Rippetoe Mark
Current Estimated Value
Purchase Details
Closed on
Jun 7, 2023
Sold by
Rippetoe Toby C and Roland Sandra
Bought by
Rippetoe Mark
Purchase Details
Closed on
Mar 16, 2021
Sold by
Rippetoe Billymark
Bought by
Rippetoe Billy H and Rippetoe Mildred C
Purchase Details
Closed on
Jul 24, 2020
Sold by
Rippetoe Billy H and Rippetoe Mildred C
Bought by
Rippetoe Billy Mark
Purchase Details
Closed on
Apr 2, 2012
Sold by
Eldridge Wilma Rose
Bought by
Rippetoe Bill Mildred C
Purchase Details
Closed on
Jul 30, 2010
Sold by
Moss Jerry D
Bought by
Moss Jerry D Le
Purchase Details
Closed on
Oct 6, 2006
Sold by
Moss Fannie
Bought by
Moss Jerry D
Purchase Details
Closed on
Jun 15, 1976
Bought by
Moss Willie Haskell and Moss Fannie
Purchase Details
Closed on
Sep 26, 1944
Purchase Details
Closed on
Apr 29, 1943
Create a Home Valuation Report for This Property
The Home Valuation Report is an in-depth analysis detailing your home's value as well as a comparison with similar homes in the area
Home Values in the Area
Average Home Value in this Area
Purchase History
| Date | Buyer | Sale Price | Title Company |
|---|---|---|---|
| Rippetoe Mark | -- | None Listed On Document | |
| Rippetoe Mark | -- | None Listed On Document | |
| Rippetoe Mark | -- | None Listed On Document | |
| Rippetoe Mark | -- | None Listed On Document | |
| Rippetoe Billy H | -- | None Available | |
| Rippetoe Billy Mark | -- | None Available | |
| Rippetoe Bill Mildred C | $95,000 | -- | |
| Moss Jerry D Le | -- | -- | |
| Moss Jerry D | -- | -- | |
| Moss Willie Haskell | -- | -- | |
| -- | -- | -- | |
| -- | -- | -- |
Source: Public Records
Tax History Compared to Growth
Tax History
| Year | Tax Paid | Tax Assessment Tax Assessment Total Assessment is a certain percentage of the fair market value that is determined by local assessors to be the total taxable value of land and additions on the property. | Land | Improvement |
|---|---|---|---|---|
| 2024 | $1,587 | $44,325 | $12,500 | $31,825 |
| 2023 | $1,587 | $44,325 | $12,500 | $31,825 |
| 2022 | $1,459 | $44,325 | $12,500 | $31,825 |
| 2021 | $1,183 | $44,325 | $12,500 | $31,825 |
| 2020 | $1,053 | $35,950 | $12,500 | $23,450 |
| 2019 | $1,053 | $26,900 | $12,500 | $14,400 |
| 2018 | $960 | $26,900 | $12,500 | $14,400 |
| 2017 | $960 | $26,900 | $12,500 | $14,400 |
| 2016 | $960 | $26,900 | $12,500 | $14,400 |
| 2015 | $997 | $26,900 | $12,500 | $14,400 |
| 2014 | $952 | $25,684 | $0 | $0 |
Source: Public Records
Map
Nearby Homes
- 141 Hunter Ave
- 769 Robinson Rd
- 0 Lewis St
- 850 Lewis St
- 501 Ash Ave
- 500 N Franklin Ave
- 1067 Crescent Dr
- 575 Hughes St
- 443 Ellis Ave
- 460 W Stevens St
- 1198 N Franklin Ave
- 1212 Crescent Dr
- 1205 Buckingham Place
- 1376 Buckingham Place
- 1308 Bridle Path
- 309 W 12th St
- 359 C Camp Rd
- 1329 Bridle Path
- 798 Buffalo Valley Rd
- 234 N Mahler