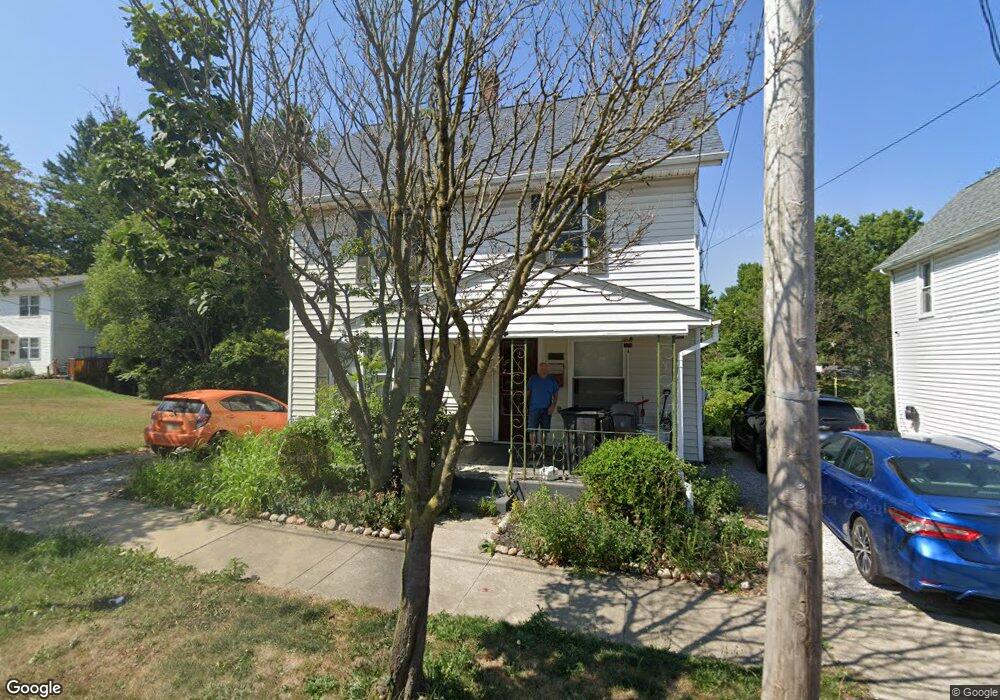
706 W Main St Ashland, OH 44805
Estimated Value: $142,000 - $196,000
4
Beds
2
Baths
1,350
Sq Ft
$122/Sq Ft
Est. Value
About This Home
This home is located at 706 W Main St, Ashland, OH 44805 and is currently estimated at $165,301, approximately $122 per square foot. 706 W Main St is a home located in Ashland County with nearby schools including Ashland High School, Ashland County Community Academy, and Ashland Christian Elementary School.
Ownership History
Date
Name
Owned For
Owner Type
Purchase Details
Closed on
Apr 29, 2014
Sold by
Snyder Michael L
Bought by
Stover Robert A and Stover Kristin A
Current Estimated Value
Home Financials for this Owner
Home Financials are based on the most recent Mortgage that was taken out on this home.
Original Mortgage
$70,000
Outstanding Balance
$53,348
Interest Rate
4.33%
Mortgage Type
New Conventional
Estimated Equity
$111,953
Purchase Details
Closed on
Dec 20, 2007
Bought by
Snyder Michael L
Purchase Details
Closed on
Sep 29, 1978
Bought by
Snyder Yvonne C
Create a Home Valuation Report for This Property
The Home Valuation Report is an in-depth analysis detailing your home's value as well as a comparison with similar homes in the area
Home Values in the Area
Average Home Value in this Area
Purchase History
| Date | Buyer | Sale Price | Title Company |
|---|---|---|---|
| Stover Robert A | $70,000 | Attorney Only | |
| Snyder Michael L | -- | -- | |
| Snyder Yvonne C | $22,000 | -- |
Source: Public Records
Mortgage History
| Date | Status | Borrower | Loan Amount |
|---|---|---|---|
| Open | Stover Robert A | $70,000 |
Source: Public Records
Tax History Compared to Growth
Tax History
| Year | Tax Paid | Tax Assessment Tax Assessment Total Assessment is a certain percentage of the fair market value that is determined by local assessors to be the total taxable value of land and additions on the property. | Land | Improvement |
|---|---|---|---|---|
| 2024 | $1,485 | $40,930 | $8,860 | $32,070 |
| 2023 | $1,414 | $40,930 | $8,860 | $32,070 |
| 2022 | $1,295 | $29,660 | $6,420 | $23,240 |
| 2021 | $1,301 | $29,660 | $6,420 | $23,240 |
| 2020 | $1,231 | $29,660 | $6,420 | $23,240 |
| 2019 | $1,092 | $24,330 | $6,380 | $17,950 |
| 2018 | $1,101 | $24,330 | $6,380 | $17,950 |
| 2017 | $1,103 | $24,330 | $6,380 | $17,950 |
| 2016 | $1,050 | $22,120 | $5,800 | $16,320 |
| 2015 | $1,041 | $22,120 | $5,800 | $16,320 |
| 2013 | $1,014 | $21,170 | $5,780 | $15,390 |
Source: Public Records
Map
Nearby Homes