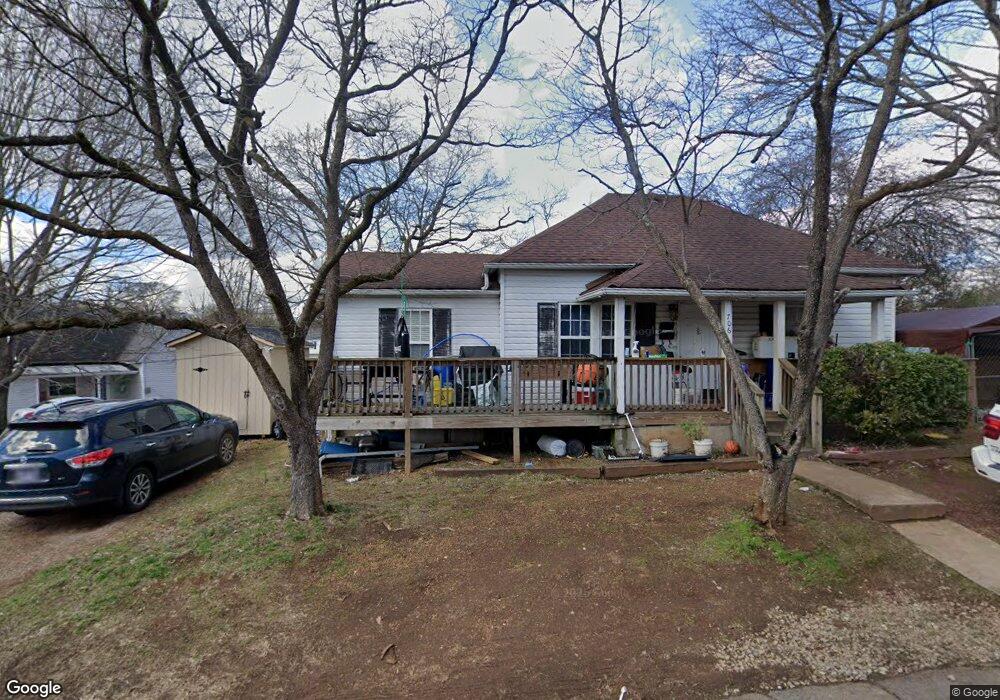
706 Wharf St Loudon, TN 37774
Estimated Value: $151,000 - $209,485
--
Bed
2
Baths
1,014
Sq Ft
$178/Sq Ft
Est. Value
About This Home
This home is located at 706 Wharf St, Loudon, TN 37774 and is currently estimated at $180,871, approximately $178 per square foot. 706 Wharf St is a home located in Loudon County with nearby schools including Loudon High School.
Ownership History
Date
Name
Owned For
Owner Type
Purchase Details
Closed on
Mar 16, 2021
Sold by
Richesin Robert E
Bought by
Richesin Robert E and Richesin Derek R
Current Estimated Value
Purchase Details
Closed on
May 14, 2014
Sold by
Pena Rene
Bought by
Pena Maria Rosario
Purchase Details
Closed on
Mar 27, 2009
Sold by
Howell Howard B
Bought by
Pena Rene
Purchase Details
Closed on
Jun 19, 2008
Sold by
Secretary Of Housing And U
Bought by
Howell Howard B
Purchase Details
Closed on
Jan 9, 2008
Bought by
Sec Of Housing & Urban Dev %Pyramid Real Esta
Purchase Details
Closed on
Feb 2, 2006
Sold by
Duncan Michael L
Bought by
Murr Jennifer A
Purchase Details
Closed on
Sep 21, 2004
Sold by
Hunt and Lois
Bought by
Duncan Michael L
Home Financials for this Owner
Home Financials are based on the most recent Mortgage that was taken out on this home.
Original Mortgage
$22,500
Interest Rate
5.75%
Purchase Details
Closed on
Nov 19, 2002
Bought by
Hunt Rowland H
Create a Home Valuation Report for This Property
The Home Valuation Report is an in-depth analysis detailing your home's value as well as a comparison with similar homes in the area
Home Values in the Area
Average Home Value in this Area
Purchase History
| Date | Buyer | Sale Price | Title Company |
|---|---|---|---|
| Richesin Robert E | -- | None Available | |
| Pena Maria Rosario | -- | -- | |
| Pena Rene | $68,000 | -- | |
| Howell Howard B | $42,504 | -- | |
| Sec Of Housing & Urban Dev %Pyramid Real Esta | $89,500 | -- | |
| Murr Jennifer A | $85,900 | -- | |
| Duncan Michael L | $25,000 | -- | |
| Hunt Rowland H | $75,000 | -- |
Source: Public Records
Mortgage History
| Date | Status | Borrower | Loan Amount |
|---|---|---|---|
| Previous Owner | Hunt Rowland H | $22,500 |
Source: Public Records
Tax History Compared to Growth
Tax History
| Year | Tax Paid | Tax Assessment Tax Assessment Total Assessment is a certain percentage of the fair market value that is determined by local assessors to be the total taxable value of land and additions on the property. | Land | Improvement |
|---|---|---|---|---|
| 2025 | $529 | $20,200 | $2,375 | $17,825 |
| 2023 | $529 | $20,200 | $0 | $0 |
| 2022 | $307 | $20,200 | $2,375 | $17,825 |
| 2021 | $529 | $20,200 | $2,375 | $17,825 |
| 2020 | $463 | $20,200 | $2,375 | $17,825 |
| 2019 | $445 | $15,225 | $2,400 | $12,825 |
| 2018 | $436 | $14,625 | $2,400 | $12,225 |
| 2017 | $436 | $14,625 | $2,400 | $12,225 |
| 2016 | $474 | $15,600 | $2,950 | $12,650 |
| 2015 | $474 | $15,600 | $2,950 | $12,650 |
| 2014 | $474 | $15,600 | $2,950 | $12,650 |
Source: Public Records
Map
Nearby Homes