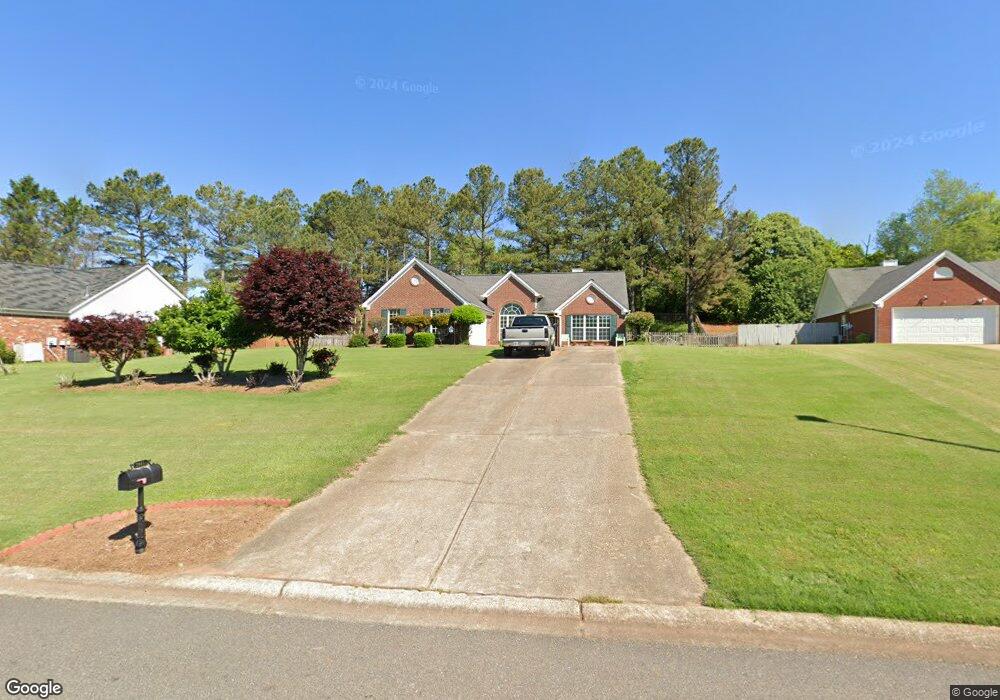
7065 Timberbrooke Dr Unit I Gainesville, GA 30506
Estimated Value: $390,000 - $435,293
3
Beds
2
Baths
1,735
Sq Ft
$242/Sq Ft
Est. Value
About This Home
This home is located at 7065 Timberbrooke Dr Unit I, Gainesville, GA 30506 and is currently estimated at $419,573, approximately $241 per square foot. 7065 Timberbrooke Dr Unit I is a home located in Forsyth County with nearby schools including Chestatee Elementary School, Little Mill Middle School, and War Hill Christian Academy.
Ownership History
Date
Name
Owned For
Owner Type
Purchase Details
Closed on
May 7, 2021
Sold by
Smith Gregory O
Bought by
Smith Beth D
Current Estimated Value
Home Financials for this Owner
Home Financials are based on the most recent Mortgage that was taken out on this home.
Original Mortgage
$19,575
Outstanding Balance
$17,740
Interest Rate
3.1%
Mortgage Type
New Conventional
Estimated Equity
$401,833
Purchase Details
Closed on
Sep 29, 2000
Sold by
Bowen & Bowen Construction Co In
Bought by
Smith Gregory O and Smith Beth D
Home Financials for this Owner
Home Financials are based on the most recent Mortgage that was taken out on this home.
Original Mortgage
$126,000
Interest Rate
7.96%
Mortgage Type
New Conventional
Create a Home Valuation Report for This Property
The Home Valuation Report is an in-depth analysis detailing your home's value as well as a comparison with similar homes in the area
Home Values in the Area
Average Home Value in this Area
Purchase History
| Date | Buyer | Sale Price | Title Company |
|---|---|---|---|
| Smith Beth D | $155,000 | -- | |
| Smith Gregory O | $140,000 | -- |
Source: Public Records
Mortgage History
| Date | Status | Borrower | Loan Amount |
|---|---|---|---|
| Open | Smith Beth D | $19,575 | |
| Previous Owner | Smith Gregory O | $126,000 |
Source: Public Records
Tax History Compared to Growth
Tax History
| Year | Tax Paid | Tax Assessment Tax Assessment Total Assessment is a certain percentage of the fair market value that is determined by local assessors to be the total taxable value of land and additions on the property. | Land | Improvement |
|---|---|---|---|---|
| 2025 | $3,032 | $153,364 | $46,000 | $107,364 |
| 2024 | $3,032 | $144,500 | $40,000 | $104,500 |
| 2023 | $2,490 | $134,468 | $40,000 | $94,468 |
| 2022 | $2,572 | $86,640 | $16,000 | $70,640 |
| 2021 | $2,064 | $86,640 | $16,000 | $70,640 |
| 2020 | $2,067 | $86,748 | $16,000 | $70,748 |
| 2019 | $2,071 | $86,776 | $14,000 | $72,776 |
| 2018 | $1,808 | $73,568 | $14,000 | $59,568 |
| 2017 | $1,719 | $69,044 | $14,000 | $55,044 |
| 2016 | $1,579 | $62,404 | $10,000 | $52,404 |
| 2015 | $1,582 | $62,404 | $10,000 | $52,404 |
| 2014 | $1,413 | $58,076 | $0 | $0 |
Source: Public Records
Map
Nearby Homes
- 6965 Timberbrooke Dr
- 7950 Waldrip Rd
- 8125 Beryl Overlook
- 8105 Jot Em Down Rd
- 6545 Westbrook Rd
- 8240 Scarlett Grace Ln
- 8320 Scarlett Grace Ln
- 8280 Scarlett Grace Ln
- 8310 Jensen Trail
- 7770 Old Keith Bridge Rd
- 8365 Gannon Trail
- 8355 Beryl Overlook
- 9220 Hannamill Dr
- 00 Dawsonville Hwy
- 8415 Beryl Overlook
- 8425 Beryl Overlook
- 8785 Amberfield Dr
- 7120 Creek Ridge Dr
- 8040 Gracen Dr
- 8815 Creekstone Place
- 7045 Timberbrooke Dr
- 7075 Timberbrooke Dr Unit 8
- 7060 Timberbrooke Dr
- 7085 Timberbrooke Dr
- 6950 Keith Bridge Rd
- 7110 Timberbrooke Dr
- 7050 Timberbrooke Dr
- 7095 Sidney Ct
- 7040 Timberbrooke Dr
- 7120 Timberbrooke Dr Unit 1
- 7030 Timberbrooke Dr
- 7025 Timberbrooke Dr
- 7105 Timberbrooke Dr Unit I
- 7115 Timberbrooke Dr
- 7020 Timberbrooke Dr
- 6995 Timberbrooke Dr
- 7125 Timberbrooke Dr
- 7130 Timberbrooke Dr Unit I
- 7170 Keith Bridge Rd