Estimated Value: $483,000 - $1,096,000
3
Beds
2
Baths
1,288
Sq Ft
$530/Sq Ft
Est. Value
About This Home
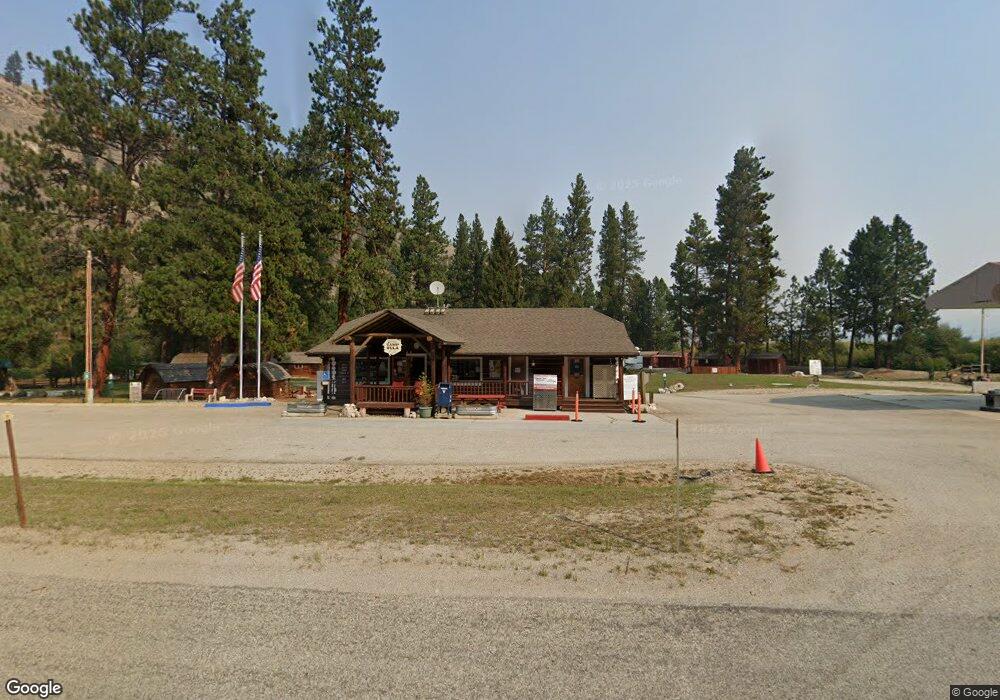
This home is located at 7067 Us Highway 93 S, Sula, MT 59871 and is currently estimated at $683,173, approximately $530 per square foot. 7067 Us Highway 93 S is a home located in Ravalli County with nearby schools including Darby Elementary School and Darby High School.
Ownership History
Date
Name
Owned For
Owner Type
Purchase Details
Closed on
Feb 10, 2022
Sold by
Sr & Jp Investments Llc
Bought by
Cw Camp Sula Llc
Current Estimated Value
Home Financials for this Owner
Home Financials are based on the most recent Mortgage that was taken out on this home.
Original Mortgage
$567,000
Outstanding Balance
$527,387
Interest Rate
3.69%
Mortgage Type
Seller Take Back
Estimated Equity
$155,786
Purchase Details
Closed on
Oct 27, 2020
Sold by
Bell Donald W and Bell Stephanie W
Bought by
Sr & Jp Investments Llc
Purchase Details
Closed on
Sep 13, 2018
Sold by
Nancy Kingsbury
Bought by
Bell Donald and Bell Stephanie W
Home Financials for this Owner
Home Financials are based on the most recent Mortgage that was taken out on this home.
Original Mortgage
$142,405
Interest Rate
4.6%
Mortgage Type
New Conventional
Purchase Details
Closed on
Nov 25, 1997
Bought by
Kingsbury John and Kingsbury Nancy
Create a Home Valuation Report for This Property
The Home Valuation Report is an in-depth analysis detailing your home's value as well as a comparison with similar homes in the area
Home Values in the Area
Average Home Value in this Area
Purchase History
| Date | Buyer | Sale Price | Title Company |
|---|---|---|---|
| Cw Camp Sula Llc | -- | New Title Company Name | |
| Sr & Jp Investments Llc | -- | Other | |
| Bell Donald | $178,006 | First American Title | |
| Kingsbury John | -- | -- |
Source: Public Records
Mortgage History
| Date | Status | Borrower | Loan Amount |
|---|---|---|---|
| Open | Cw Camp Sula Llc | $567,000 | |
| Previous Owner | Bell Donald | $142,405 |
Source: Public Records
Tax History Compared to Growth
Tax History
| Year | Tax Paid | Tax Assessment Tax Assessment Total Assessment is a certain percentage of the fair market value that is determined by local assessors to be the total taxable value of land and additions on the property. | Land | Improvement |
|---|---|---|---|---|
| 2025 | $1,426 | $483,100 | $0 | $0 |
| 2024 | $1,879 | $390,200 | $0 | $0 |
| 2023 | $1,867 | $390,200 | $0 | $0 |
| 2022 | $1,776 | $328,300 | $0 | $0 |
| 2021 | $1,922 | $328,300 | $0 | $0 |
| 2020 | $1,599 | $259,600 | $0 | $0 |
| 2019 | $1,584 | $259,600 | $0 | $0 |
| 2018 | $1,492 | $232,600 | $0 | $0 |
| 2017 | $1,494 | $232,600 | $0 | $0 |
| 2016 | $1,552 | $241,100 | $0 | $0 |
| 2015 | $1,174 | $241,100 | $0 | $0 |
| 2014 | $1,056 | $151,094 | $0 | $0 |
Source: Public Records
Map
Nearby Homes
- 404 Reimel Loop
- 260 Medicine Springs Rd
- 162 Medicine Springs Rd
- 271 & 259 Laird Creek Rd
- 8131 Us Highway 93 S
- 5900 Us Highway 93 S
- Tbd Hwy 93 S
- 5855 Serenity Ln
- 283 Lost Trail Hot Springs Rd
- Nhn Medicine Springs Rd
- 357 Blind Draw Rd
- 5388 Us Highway 93 S
- 279 Conner Cutoff Rd
- 4310 Dugout Gulch Rd
- 181 Hart Bench Rd
- 203 Hart Bench Rd
- Nhn Dugout Gulch Rd
- 241 Orr Loop Rd
- NHN Baker Trail Rd
- 50 Tippet Trail
- 7067 Us Hwy 93 S
- NHN Guide Saddle Rd
- 7067 Us Highway 93 S
- E Street Springer Memorial
- NHN Sula Sanctuary
- 7060 Us Highway 93 S
- 7060 Us Hwy 93 S
- 7060 Us Highway 93 S
- 7060 U S 93
- 7040 Us-93
- 7040 U S 93
- 7021 U S 93
- Nhn Us Hwy 93 S
- 262 E Fork Rd
- 6911 Edwards Rd
- 6948 Edwards Rd
- 6988 Edwards Rd
- 100-400 Reimel Creek Rd
- 279 E Fork Rd
- 279 E Fork Rd