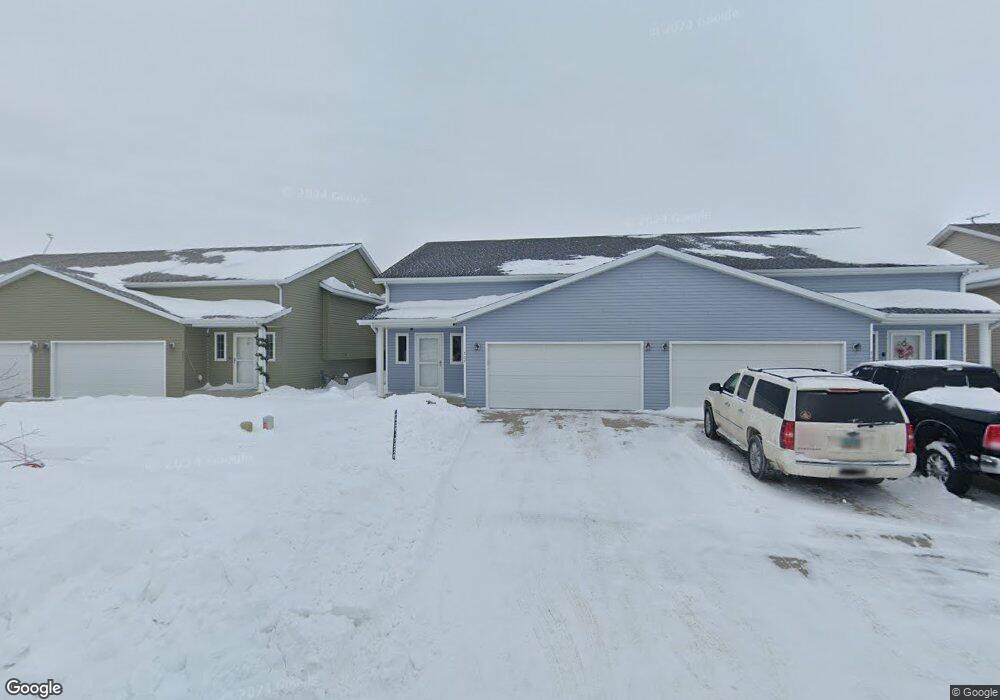
707 13 1/2 Ave E West Fargo, ND 58078
Charleswood NeighborhoodEstimated Value: $264,000 - $276,667
3
Beds
2
Baths
1,890
Sq Ft
$143/Sq Ft
Est. Value
About This Home
This home is located at 707 13 1/2 Ave E, West Fargo, ND 58078 and is currently estimated at $270,334, approximately $143 per square foot. 707 13 1/2 Ave E is a home located in Cass County with nearby schools including South Elementary School, Cheney Middle School, and West Fargo High School.
Ownership History
Date
Name
Owned For
Owner Type
Purchase Details
Closed on
May 25, 2021
Sold by
Ken Anne Properties Llc
Bought by
Pearson Hope
Current Estimated Value
Home Financials for this Owner
Home Financials are based on the most recent Mortgage that was taken out on this home.
Original Mortgage
$199,820
Outstanding Balance
$180,804
Interest Rate
3%
Mortgage Type
New Conventional
Estimated Equity
$89,530
Purchase Details
Closed on
Sep 13, 2019
Sold by
Dohleman Thomas J
Bought by
Ken Anne Properties Llc
Purchase Details
Closed on
Mar 29, 2019
Sold by
Jstar Properties Llc
Bought by
Scott Breidenbach Inc
Purchase Details
Closed on
Jul 16, 2009
Sold by
Jordahl Custom Homes Inc
Bought by
Miller Brandon J and Miller Natalie
Create a Home Valuation Report for This Property
The Home Valuation Report is an in-depth analysis detailing your home's value as well as a comparison with similar homes in the area
Home Values in the Area
Average Home Value in this Area
Purchase History
| Date | Buyer | Sale Price | Title Company |
|---|---|---|---|
| Pearson Hope | $206,000 | North Dakota Guaranty & Titl | |
| Ken Anne Properties Llc | -- | None Available | |
| Scott Breidenbach Inc | $185,000 | Fm Title | |
| Miller Brandon J | -- | -- |
Source: Public Records
Mortgage History
| Date | Status | Borrower | Loan Amount |
|---|---|---|---|
| Open | Pearson Hope | $199,820 |
Source: Public Records
Tax History Compared to Growth
Tax History
| Year | Tax Paid | Tax Assessment Tax Assessment Total Assessment is a certain percentage of the fair market value that is determined by local assessors to be the total taxable value of land and additions on the property. | Land | Improvement |
|---|---|---|---|---|
| 2024 | $3,352 | $114,550 | $16,850 | $97,700 |
| 2023 | $3,224 | $109,100 | $16,850 | $92,250 |
| 2022 | $3,173 | $102,550 | $16,850 | $85,700 |
| 2021 | $2,993 | $92,850 | $14,300 | $78,550 |
| 2020 | $2,830 | $91,400 | $14,300 | $77,100 |
| 2019 | $2,632 | $90,900 | $14,300 | $76,600 |
| 2018 | $3,285 | $90,150 | $14,300 | $75,850 |
| 2017 | $3,192 | $86,600 | $14,300 | $72,300 |
| 2016 | $3,104 | $84,400 | $14,300 | $70,100 |
| 2015 | $3,085 | $76,450 | $6,950 | $69,500 |
| 2014 | $2,920 | $71,450 | $6,950 | $64,500 |
| 2013 | $2,919 | $68,950 | $6,950 | $62,000 |
Source: Public Records
Map
Nearby Homes
- 707 13 1 2 Ave S
- 711 13 1/2 Ave E
- 705 13 1/2 Ave E
- 705 13 1 2 Ave S
- 623 13 1/2 Ave E
- 713 13 1/2 Ave E
- 708 14th Ave E
- 706 14th Ave E
- 712 14th Ave E
- 621 13 1/2 Ave E
- 717 13 1/2 Ave E
- 717 13 1 2 Ave E
- 621 13 1 2 Ave S
- 624 14th Ave E
- 714 14th Ave E
- 719 13 1 2 Ave S
- 719 13 1/2 Ave E
- 622 14th Ave E
- 617 13 1/2 Ave E
- 718 14th Ave E