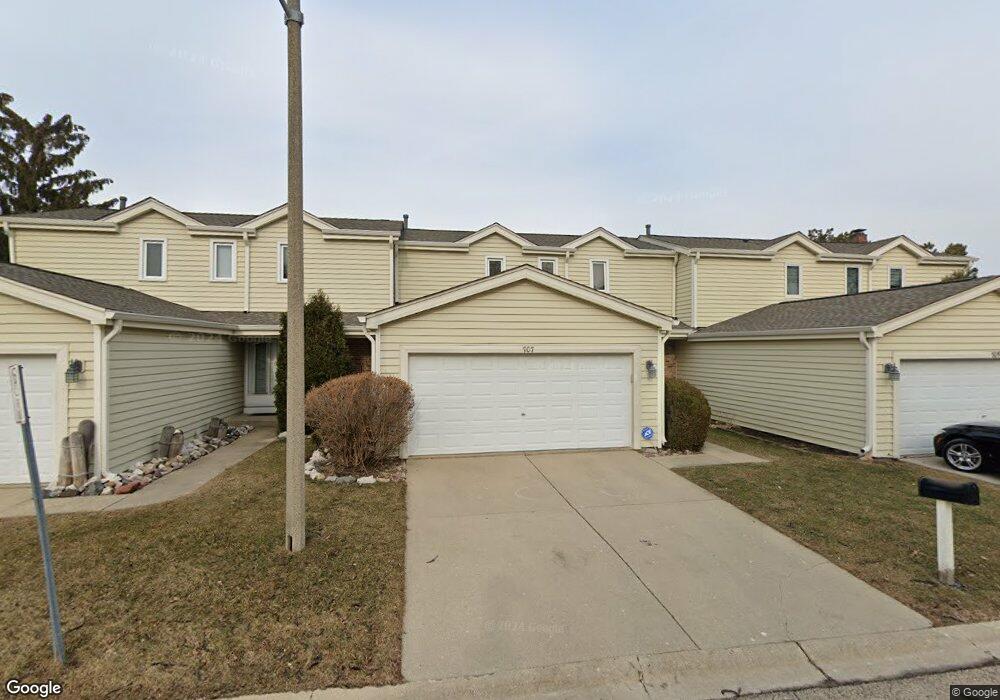
707 Ascot Ct Unit 16 Hoffman Estates, IL 60169
South Hoffman Estates NeighborhoodEstimated Value: $371,000 - $410,000
3
Beds
3
Baths
1,700
Sq Ft
$229/Sq Ft
Est. Value
About This Home
This home is located at 707 Ascot Ct Unit 16, Hoffman Estates, IL 60169 and is currently estimated at $388,534, approximately $228 per square foot. 707 Ascot Ct Unit 16 is a home located in Cook County with nearby schools including Enders-Salk Elementary School, Helen Keller Junior High School, and Schaumburg High School.
Ownership History
Date
Name
Owned For
Owner Type
Purchase Details
Closed on
Dec 3, 2009
Sold by
Flaska Darin E and Flaska Breeana R
Bought by
Lick Ellen R and Lick Carole M
Current Estimated Value
Home Financials for this Owner
Home Financials are based on the most recent Mortgage that was taken out on this home.
Original Mortgage
$242,526
Outstanding Balance
$159,161
Interest Rate
5.02%
Mortgage Type
FHA
Estimated Equity
$229,373
Purchase Details
Closed on
Mar 24, 2005
Sold by
Lovda Mary and Lovda Michael Andrew
Bought by
Flaska Darin E and Flaska Breeana R
Home Financials for this Owner
Home Financials are based on the most recent Mortgage that was taken out on this home.
Original Mortgage
$191,200
Interest Rate
5.71%
Mortgage Type
Unknown
Purchase Details
Closed on
Oct 2, 1998
Sold by
Shapel Sophie
Bought by
Shapel Sophie and Sophie Shapel Trust
Create a Home Valuation Report for This Property
The Home Valuation Report is an in-depth analysis detailing your home's value as well as a comparison with similar homes in the area
Home Values in the Area
Average Home Value in this Area
Purchase History
| Date | Buyer | Sale Price | Title Company |
|---|---|---|---|
| Lick Ellen R | $247,000 | None Available | |
| Flaska Darin E | $239,000 | -- | |
| Shapel Sophie | -- | -- |
Source: Public Records
Mortgage History
| Date | Status | Borrower | Loan Amount |
|---|---|---|---|
| Open | Lick Ellen R | $242,526 | |
| Previous Owner | Flaska Darin E | $191,200 | |
| Closed | Flaska Darin E | $47,800 |
Source: Public Records
Tax History Compared to Growth
Tax History
| Year | Tax Paid | Tax Assessment Tax Assessment Total Assessment is a certain percentage of the fair market value that is determined by local assessors to be the total taxable value of land and additions on the property. | Land | Improvement |
|---|---|---|---|---|
| 2024 | $7,268 | $27,000 | $4,500 | $22,500 |
| 2023 | $7,003 | $27,000 | $4,500 | $22,500 |
| 2022 | $7,003 | $27,000 | $4,500 | $22,500 |
| 2021 | $6,411 | $22,466 | $3,088 | $19,378 |
| 2020 | $6,336 | $22,466 | $3,088 | $19,378 |
| 2019 | $6,304 | $24,963 | $3,088 | $21,875 |
| 2018 | $5,697 | $20,906 | $2,613 | $18,293 |
| 2017 | $5,615 | $20,906 | $2,613 | $18,293 |
| 2016 | $5,484 | $20,906 | $2,613 | $18,293 |
| 2015 | $4,471 | $16,543 | $2,257 | $14,286 |
| 2014 | $4,409 | $16,543 | $2,257 | $14,286 |
| 2013 | $3,700 | $16,543 | $2,257 | $14,286 |
Source: Public Records
Map
Nearby Homes
- 501 Argyll Ln
- 1105 Wilmington Ln
- 421 N Braintree Dr
- 1074 Wilmington Ln
- 1025 Higgins Quarters Dr Unit 4-109
- 645 Maywood Ln
- 1085 Higgins Quarters Dr Unit 104
- 1075 Higgins Quarters Dr Unit 3-208
- 565 Flagstaff Ln
- 730 Hill Dr Unit 9205
- 1080 Knoll Ln Unit 305
- 1123 Stoughton Ct Unit 1664
- 720 Hill Dr Unit 8303
- 640 Downey St
- 365 Washington Blvd
- 225 Barcliffe Ln Unit 1011
- 615 Hill Dr Unit 303
- 1314 Colwyn Dr
- 1475 Crowfoot Cir S
- 510 Milan Ln
- 709 Ascot Ct
- 705 Ascot Ct
- 711 Ascot Ct Unit 14
- 713 Ascot Ct Unit 13
- 703 Ascot Ct Unit 18
- 701 Ascot Ct Unit 19
- 715 Ascot Ct
- 715 Ascot Ct
- 715 Ascot Ct
- 731 Ascot Ct Unit 4
- 717 Ascot Ct Unit 11
- 729 Ascot Ct
- 727 Ascot Ct Unit 6
- 687 London Square
- 698 Partridge Hill Dr
- 733 Ascot Ct Unit 3
- 689 London Square Unit 23
- 696 Partridge Hill Dr Unit 191
- 725 Ascot Ct
- 691 London Square Unit 22