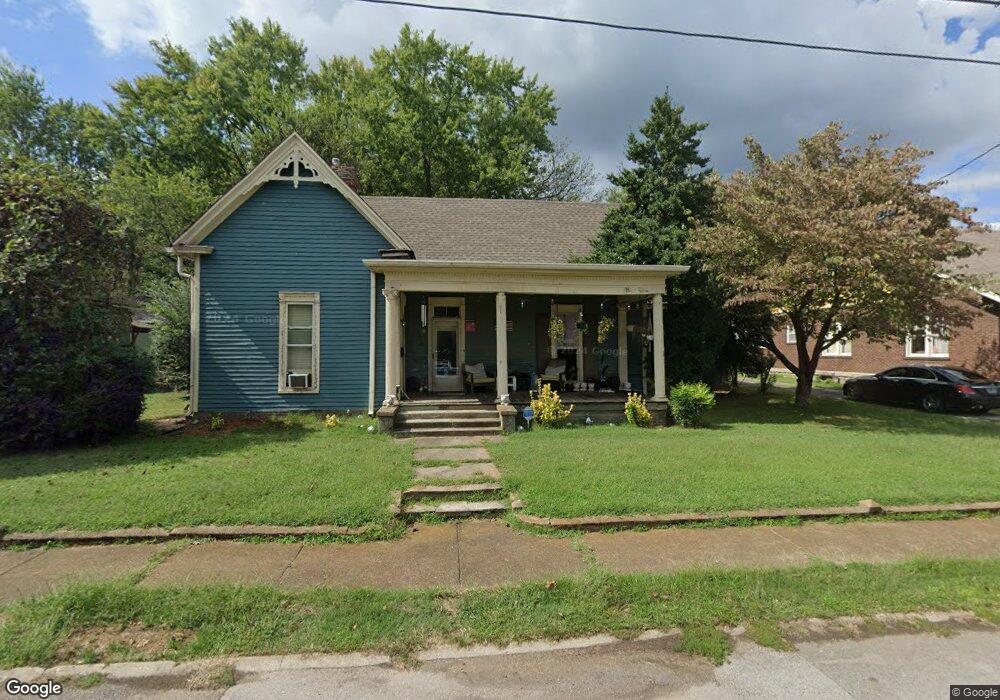
707 Cheatham St Springfield, TN 37172
Estimated Value: $287,710 - $361,000
Studio
2
Baths
2,046
Sq Ft
$153/Sq Ft
Est. Value
About This Home
This home is located at 707 Cheatham St, Springfield, TN 37172 and is currently estimated at $312,928, approximately $152 per square foot. 707 Cheatham St is a home located in Robertson County with nearby schools including Cheatham Park Elementary School, Westside Elementary School, and Innovation Academy.
Ownership History
Date
Name
Owned For
Owner Type
Purchase Details
Closed on
Jan 25, 2010
Sold by
U S Bank Na
Bought by
Rulison Heather
Current Estimated Value
Purchase Details
Closed on
May 7, 2009
Sold by
Wellman Jeremy
Bought by
U S Bank Na
Purchase Details
Closed on
Aug 15, 2006
Sold by
Jones Patsy Riley
Bought by
Wellman Jeremy and Wellman Tamala
Home Financials for this Owner
Home Financials are based on the most recent Mortgage that was taken out on this home.
Original Mortgage
$119,920
Interest Rate
8.4%
Purchase Details
Closed on
Jan 6, 2003
Sold by
Watson Harry C and Watson Kathy J
Bought by
Jones Patsy Riley
Purchase Details
Closed on
May 1, 2002
Sold by
Walling Carl B
Bought by
Watson Harry C
Purchase Details
Closed on
Sep 21, 1978
Bought by
Walling Margaret W
Purchase Details
Closed on
Jan 1, 1978
Create a Home Valuation Report for This Property
The Home Valuation Report is an in-depth analysis detailing your home's value as well as a comparison with similar homes in the area
Home Values in the Area
Average Home Value in this Area
Purchase History
| Date | Buyer | Sale Price | Title Company |
|---|---|---|---|
| Rulison Heather | $102,000 | -- | |
| U S Bank Na | $130,161 | -- | |
| Wellman Jeremy | $149,900 | -- | |
| Jones Patsy Riley | $105,000 | -- | |
| Watson Harry C | $55,000 | -- | |
| Walling Margaret W | -- | -- | |
| -- | $21,800 | -- |
Source: Public Records
Mortgage History
| Date | Status | Borrower | Loan Amount |
|---|---|---|---|
| Open | Not Available | $92,330 | |
| Previous Owner | Not Available | $119,920 |
Source: Public Records
Tax History
| Year | Tax Paid | Tax Assessment Tax Assessment Total Assessment is a certain percentage of the fair market value that is determined by local assessors to be the total taxable value of land and additions on the property. | Land | Improvement |
|---|---|---|---|---|
| 2025 | -- | $54,600 | $9,375 | $45,225 |
| 2024 | -- | $54,600 | $9,375 | $45,225 |
| 2023 | $1,368 | $54,600 | $9,375 | $45,225 |
| 2022 | $980 | $26,850 | $2,500 | $24,350 |
| 2021 | $980 | $26,850 | $2,500 | $24,350 |
| 2020 | $980 | $26,850 | $2,500 | $24,350 |
| 2019 | $29,492 | $26,850 | $2,500 | $24,350 |
| 2018 | $980 | $26,850 | $2,500 | $24,350 |
| 2017 | $1,070 | $24,975 | $2,150 | $22,825 |
| 2016 | $1,070 | $24,975 | $2,150 | $22,825 |
| 2015 | $1,039 | $24,975 | $2,150 | $22,825 |
| 2014 | $1,039 | $24,975 | $2,150 | $22,825 |
Source: Public Records
Map
Nearby Homes
- 709 Cheatham St
- 705 Cheatham St
- 703 Cheatham St
- 706 Cheatham St
- 712 Cheatham St
- 708 Cheatham St
- 704 Cheatham St
- 710 Cheatham St
- 701 Cheatham St
- 714 Cheatham St
- 702 Cheatham St
- 700 Cheatham St
- 716 Cheatham St
- 106 7th Ave W
- 306 7th Ave W
- 306 7th Ave W
- 718 Cheatham St
- 607 S Locust St
- 607 S Locust St Unit Upstairs
- 103 7th Ave W
Your Personal Tour Guide
Ask me questions while you tour the home.