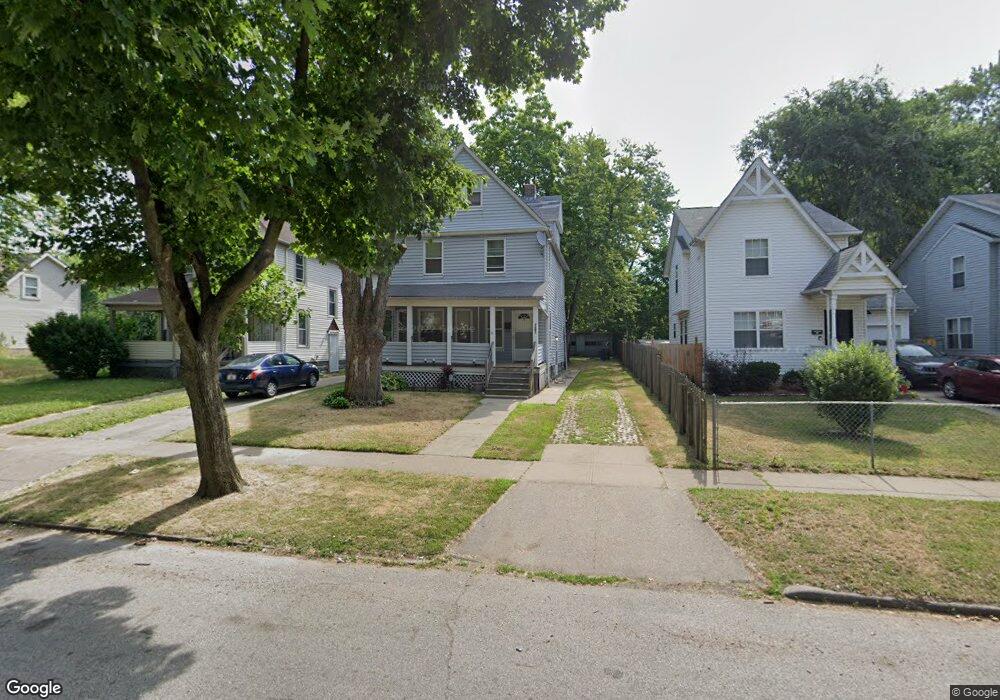
707 E 99th St Cleveland, OH 44108
Glenville NeighborhoodEstimated Value: $72,000 - $113,000
3
Beds
1
Bath
1,444
Sq Ft
$60/Sq Ft
Est. Value
About This Home
This home is located at 707 E 99th St, Cleveland, OH 44108 and is currently estimated at $86,627, approximately $59 per square foot. 707 E 99th St is a home located in Cuyahoga County with nearby schools including Bolton, Anton Grdina School, and Andrew J. Rickoff School.
Ownership History
Date
Name
Owned For
Owner Type
Purchase Details
Closed on
Dec 5, 2023
Sold by
Lembright Mark R
Bought by
Secretary/Housing & Urban Dev and Fin'L Freedom Senior Fund Corp
Current Estimated Value
Purchase Details
Closed on
Sep 23, 2008
Sold by
Williams Linsey and Williams Lindsey
Bought by
Williams Lindsey
Home Financials for this Owner
Home Financials are based on the most recent Mortgage that was taken out on this home.
Original Mortgage
$157,500
Interest Rate
3.69%
Mortgage Type
Reverse Mortgage Home Equity Conversion Mortgage
Purchase Details
Closed on
Aug 21, 1991
Sold by
Williams Linsey
Bought by
Williams Linsey
Purchase Details
Closed on
Feb 28, 1986
Sold by
Mills Ebonie
Bought by
Williams Linsey
Purchase Details
Closed on
Feb 28, 1984
Sold by
Hubbard Cordell
Bought by
Mills Ebonie
Purchase Details
Closed on
Mar 2, 1979
Bought by
Hubbard Cordell
Purchase Details
Closed on
Jul 17, 1978
Sold by
Glendale Fed Savings
Bought by
Sec Of H U D
Purchase Details
Closed on
Jan 1, 1975
Bought by
Moody Devon
Create a Home Valuation Report for This Property
The Home Valuation Report is an in-depth analysis detailing your home's value as well as a comparison with similar homes in the area
Home Values in the Area
Average Home Value in this Area
Purchase History
| Date | Buyer | Sale Price | Title Company |
|---|---|---|---|
| Secretary/Housing & Urban Dev | $144,529 | None Listed On Document | |
| Williams Lindsey | -- | Attorney | |
| Williams Linsey | $24,000 | -- | |
| Williams Linsey | $24,900 | -- | |
| Mills Ebonie | -- | -- | |
| Hubbard Cordell | -- | -- | |
| Sec Of H U D | -- | -- | |
| Glendale Fed Savings | -- | -- | |
| Moody Devon | -- | -- |
Source: Public Records
Mortgage History
| Date | Status | Borrower | Loan Amount |
|---|---|---|---|
| Previous Owner | Williams Lindsey | $157,500 |
Source: Public Records
Tax History Compared to Growth
Tax History
| Year | Tax Paid | Tax Assessment Tax Assessment Total Assessment is a certain percentage of the fair market value that is determined by local assessors to be the total taxable value of land and additions on the property. | Land | Improvement |
|---|---|---|---|---|
| 2024 | $443 | $16,555 | $3,780 | $12,775 |
| 2023 | $80 | $10,230 | $2,980 | $7,250 |
| 2022 | $112 | $10,220 | $2,980 | $7,250 |
| 2021 | $110 | $10,220 | $2,980 | $7,250 |
| 2020 | $0 | $8,400 | $2,450 | $5,950 |
| 2019 | $1,528 | $24,000 | $7,000 | $17,000 |
| 2018 | $162 | $8,400 | $2,450 | $5,950 |
| 2017 | $327 | $12,710 | $2,700 | $10,010 |
| 2016 | $324 | $12,710 | $2,700 | $10,010 |
| 2015 | $667 | $12,710 | $2,700 | $10,010 |
| 2014 | $667 | $14,110 | $3,010 | $11,100 |
Source: Public Records
Map
Nearby Homes
- 614 E 97th St
- 691 E 92nd St
- 769 E 103rd St
- 606 E 103rd St
- 10307 Marlowe Ave
- 9902 Garfield Ave
- 569 E 101st St
- 568 E 101st St
- 658 E 92nd St
- 554 E 101st St
- 10523 Helena Ave
- 769 E 90th St
- 10100 Yale Ave
- 730 E 90th St
- 666 Parkwood Dr
- 10003 Empire Ave
- 9210 Yale Ave
- 10413 Yale Ave
- 9508 Empire Ave
- 9502 Empire Ave