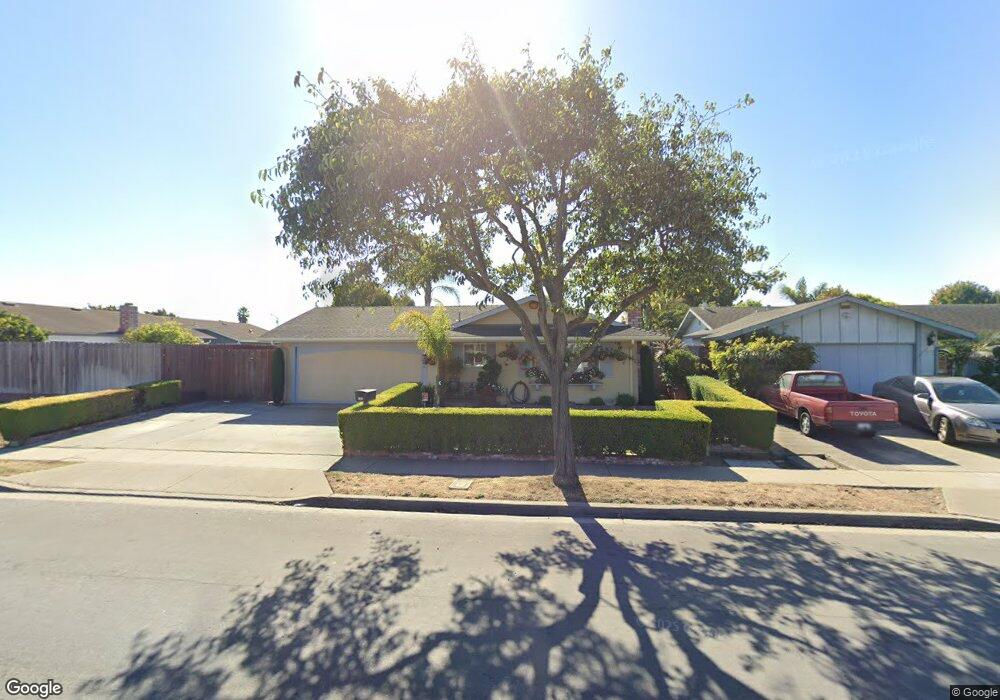
707 Larkin St Unit 3 Salinas, CA 93907
Boronda NeighborhoodEstimated Value: $654,380 - $716,000
4
Beds
3
Baths
1,232
Sq Ft
$554/Sq Ft
Est. Value
About This Home
This home is located at 707 Larkin St Unit 3, Salinas, CA 93907 and is currently estimated at $683,095, approximately $554 per square foot. 707 Larkin St Unit 3 is a home located in Monterey County with nearby schools including Laurel Wood Elementary School, Roosevelt Elementary School, and Washington Middle School.
Ownership History
Date
Name
Owned For
Owner Type
Purchase Details
Closed on
Mar 4, 1999
Sold by
Lopez Felipe Cabrera and Cabrera Angelina A
Bought by
Lopez Felipe Cabrera and Cabrera Angelina A
Current Estimated Value
Home Financials for this Owner
Home Financials are based on the most recent Mortgage that was taken out on this home.
Original Mortgage
$118,000
Outstanding Balance
$28,437
Interest Rate
6.7%
Estimated Equity
$654,658
Purchase Details
Closed on
May 7, 1996
Sold by
Overman Margie and Overman Family Trust
Bought by
Lopez Felipe Cabrera and Cabrera Angelina A
Home Financials for this Owner
Home Financials are based on the most recent Mortgage that was taken out on this home.
Original Mortgage
$132,200
Interest Rate
7.68%
Create a Home Valuation Report for This Property
The Home Valuation Report is an in-depth analysis detailing your home's value as well as a comparison with similar homes in the area
Home Values in the Area
Average Home Value in this Area
Purchase History
| Date | Buyer | Sale Price | Title Company |
|---|---|---|---|
| Lopez Felipe Cabrera | -- | Stewart Title | |
| Lopez Felipe Cabrera | $147,000 | Chicago Title Co |
Source: Public Records
Mortgage History
| Date | Status | Borrower | Loan Amount |
|---|---|---|---|
| Open | Lopez Felipe Cabrera | $118,000 | |
| Closed | Lopez Felipe Cabrera | $132,200 |
Source: Public Records
Tax History Compared to Growth
Tax History
| Year | Tax Paid | Tax Assessment Tax Assessment Total Assessment is a certain percentage of the fair market value that is determined by local assessors to be the total taxable value of land and additions on the property. | Land | Improvement |
|---|---|---|---|---|
| 2025 | $2,750 | $244,173 | $116,272 | $127,901 |
| 2024 | $2,750 | $239,387 | $113,993 | $125,394 |
| 2023 | $2,656 | $234,694 | $111,758 | $122,936 |
| 2022 | $2,554 | $230,093 | $109,567 | $120,526 |
| 2021 | $2,452 | $225,582 | $107,419 | $118,163 |
| 2020 | $2,384 | $223,270 | $106,318 | $116,952 |
| 2019 | $2,364 | $218,893 | $104,234 | $114,659 |
| 2018 | $2,331 | $214,602 | $102,191 | $112,411 |
| 2017 | $2,332 | $210,395 | $100,188 | $110,207 |
| 2016 | $2,332 | $206,271 | $98,224 | $108,047 |
| 2015 | $2,351 | $203,174 | $96,749 | $106,425 |
| 2014 | $2,193 | $199,195 | $94,854 | $104,341 |
Source: Public Records
Map
Nearby Homes
- 983 Flint Way
- 1055 Howe Cir
- 549 Powell St
- 515 Stockton St
- 424 Brighton St
- 350 Victor St
- 417 Tyler Place Unit I
- 114 Iris Dr
- 1117 Baldwin St Unit 6
- 1117 Baldwin St Unit 5
- 230 Martella St
- 29 Buena Vista St
- 129 Rodeo Ave
- 23 Capitol St
- 216 Crescent Way
- 44 Oconnor Cir
- 225 Loma Dr
- 315 Archer St
- 15 Saint Francis Way
- 315 3151/2 Archer St
- 711 Larkin St
- 991 Flint Way
- 987 Flint Way
- 708 Colton Dr
- 712 Colton Dr
- 719 Larkin St
- 716 Colton Dr
- 1003 Flint Cir
- 710 Larkin St
- 721 Larkin St
- 722 Colton Dr
- 1001 Kearny Way
- 1007 Flint Cir
- 1014 Kearny Way
- 726 Colton Dr Unit 3
- 709 Colton Dr
- 713 Colton Dr Unit 3
- 705 Colton Dr
- 717 Colton Dr
- 1007 Kearny Way