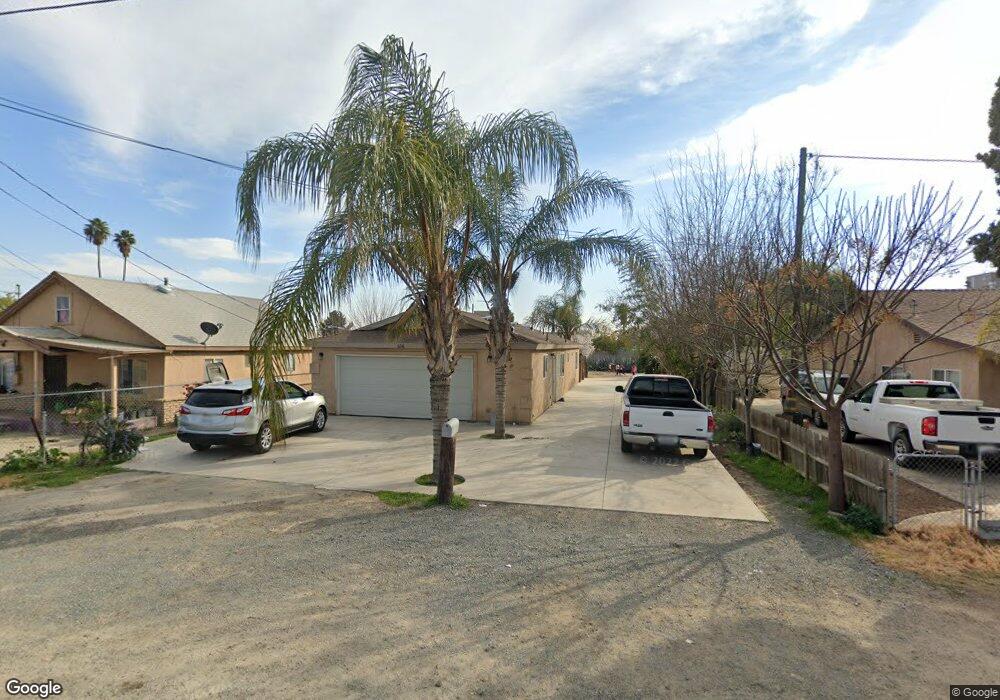
707 Mayer Ln Shafter, CA 93263
Estimated Value: $254,000 - $301,416
3
Beds
2
Baths
1,067
Sq Ft
$263/Sq Ft
Est. Value
About This Home
This home is located at 707 Mayer Ln, Shafter, CA 93263 and is currently estimated at $280,354, approximately $262 per square foot. 707 Mayer Ln is a home located in Kern County with nearby schools including Redwood Elementary School, Golden Oak Elementary School, and Shafter High School.
Ownership History
Date
Name
Owned For
Owner Type
Purchase Details
Closed on
Apr 21, 2010
Sold by
Garcia Martin
Bought by
Garcia Rosa
Current Estimated Value
Purchase Details
Closed on
Aug 25, 2008
Sold by
Nunez Josefina
Bought by
Garcia Rosa and Garcia Martin
Home Financials for this Owner
Home Financials are based on the most recent Mortgage that was taken out on this home.
Original Mortgage
$170,000
Outstanding Balance
$112,368
Interest Rate
6.39%
Mortgage Type
Seller Take Back
Estimated Equity
$167,986
Create a Home Valuation Report for This Property
The Home Valuation Report is an in-depth analysis detailing your home's value as well as a comparison with similar homes in the area
Home Values in the Area
Average Home Value in this Area
Purchase History
| Date | Buyer | Sale Price | Title Company |
|---|---|---|---|
| Garcia Rosa | -- | None Available | |
| Garcia Rosa | $180,000 | First American Title Co |
Source: Public Records
Mortgage History
| Date | Status | Borrower | Loan Amount |
|---|---|---|---|
| Open | Garcia Rosa | $170,000 |
Source: Public Records
Tax History
| Year | Tax Paid | Tax Assessment Tax Assessment Total Assessment is a certain percentage of the fair market value that is determined by local assessors to be the total taxable value of land and additions on the property. | Land | Improvement |
|---|---|---|---|---|
| 2025 | $2,541 | $199,586 | $25,746 | $173,840 |
| 2024 | $2,460 | $195,674 | $25,242 | $170,432 |
| 2023 | $2,460 | $191,839 | $24,748 | $167,091 |
| 2022 | $2,380 | $188,078 | $24,263 | $163,815 |
| 2021 | $2,311 | $184,391 | $23,788 | $160,603 |
| 2020 | $2,164 | $175,000 | $25,000 | $150,000 |
| 2019 | $1,844 | $145,000 | $30,000 | $115,000 |
| 2018 | $1,681 | $134,000 | $34,000 | $100,000 |
| 2017 | $1,642 | $129,000 | $32,000 | $97,000 |
| 2016 | $1,729 | $142,000 | $36,000 | $106,000 |
| 2015 | $1,917 | $160,000 | $40,000 | $120,000 |
| 2014 | $1,553 | $129,000 | $32,000 | $97,000 |
Source: Public Records
Map
Nearby Homes
Your Personal Tour Guide
Ask me questions while you tour the home.