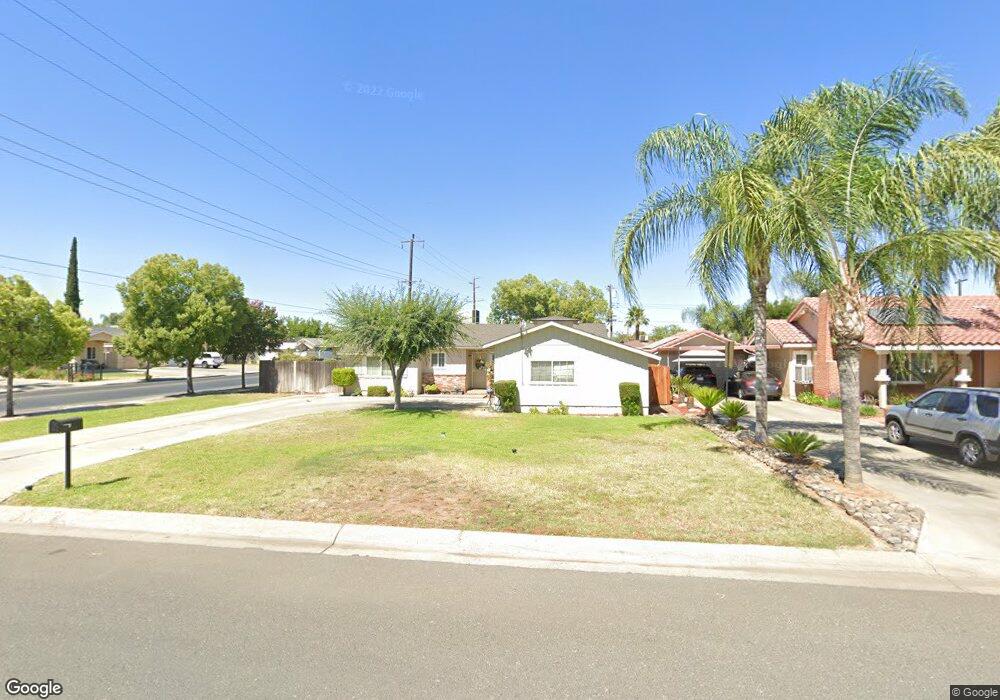
707 N Bellah Ave Unit 1 Lindsay, CA 93247
Estimated Value: $288,818 - $312,000
3
Beds
2
Baths
1,160
Sq Ft
$258/Sq Ft
Est. Value
About This Home
This home is located at 707 N Bellah Ave Unit 1, Lindsay, CA 93247 and is currently estimated at $299,205, approximately $257 per square foot. 707 N Bellah Ave Unit 1 is a home located in Tulare County with nearby schools including Lincoln Elementary School, Lindsay Senior High School, and Loma Vista Charter.
Ownership History
Date
Name
Owned For
Owner Type
Purchase Details
Closed on
Aug 10, 2010
Sold by
Lira Jose I
Bought by
Lemus Elvia Rangel
Current Estimated Value
Home Financials for this Owner
Home Financials are based on the most recent Mortgage that was taken out on this home.
Original Mortgage
$86,500
Outstanding Balance
$57,098
Interest Rate
4.51%
Mortgage Type
Stand Alone Second
Estimated Equity
$242,107
Purchase Details
Closed on
Apr 16, 2010
Sold by
Williams Edgar K
Bought by
Rangel Lemus Elvia
Home Financials for this Owner
Home Financials are based on the most recent Mortgage that was taken out on this home.
Original Mortgage
$43,456
Interest Rate
5.5%
Mortgage Type
FHA
Purchase Details
Closed on
May 1, 2009
Sold by
Williams Edgar K
Bought by
Williams Edgar K and Parks Priscilla A
Purchase Details
Closed on
Sep 14, 2007
Sold by
Williams Edgar Kirby
Bought by
Williams Edgar Kirby and Williams Frances Carolyn
Create a Home Valuation Report for This Property
The Home Valuation Report is an in-depth analysis detailing your home's value as well as a comparison with similar homes in the area
Home Values in the Area
Average Home Value in this Area
Purchase History
| Date | Buyer | Sale Price | Title Company |
|---|---|---|---|
| Lemus Elvia Rangel | -- | Chicago Title Company | |
| Rangel Lemus Elvia | $132,500 | Chicago Title Company | |
| Williams Edgar K | -- | None Available | |
| Williams Edgar K | -- | None Available | |
| Williams Edgar K | -- | None Available | |
| Williams Edgar Kirby | -- | None Available | |
| Williams Edgar Kirby | -- | None Available |
Source: Public Records
Mortgage History
| Date | Status | Borrower | Loan Amount |
|---|---|---|---|
| Open | Lemus Elvia Rangel | $86,500 | |
| Previous Owner | Rangel Lemus Elvia | $43,456 |
Source: Public Records
Tax History Compared to Growth
Tax History
| Year | Tax Paid | Tax Assessment Tax Assessment Total Assessment is a certain percentage of the fair market value that is determined by local assessors to be the total taxable value of land and additions on the property. | Land | Improvement |
|---|---|---|---|---|
| 2025 | $2,407 | $169,754 | $51,245 | $118,509 |
| 2024 | $2,407 | $166,427 | $50,241 | $116,186 |
| 2023 | $2,358 | $163,164 | $49,256 | $113,908 |
| 2022 | $2,742 | $159,966 | $48,291 | $111,675 |
| 2021 | $2,618 | $156,829 | $47,344 | $109,485 |
| 2020 | $1,769 | $155,221 | $46,859 | $108,362 |
| 2019 | $1,755 | $152,177 | $45,940 | $106,237 |
| 2018 | $1,710 | $149,193 | $45,039 | $104,154 |
| 2017 | $1,703 | $146,268 | $44,156 | $102,112 |
| 2016 | $1,626 | $143,400 | $43,290 | $100,110 |
| 2015 | $1,679 | $141,246 | $42,640 | $98,606 |
| 2014 | $1,679 | $138,479 | $41,805 | $96,674 |
Source: Public Records
Map
Nearby Homes
- 660 E Tulare Rd
- 216 Oxford Ave
- 132 N Gale Hill Ave
- 143 N Harvard Ave
- 1021 Princeton Ave
- 196 S Mirage Ave
- 1065 W Yale Ave
- 430 Central Ave
- 207 Pleasant St
- 1061 Laurel Ave
- 517 N Westwood Ave
- 330 Van Ness Ave
- 1341 Hillcrest Dr
- 1285 Road 216
- 24104 N Bellah Ave
- 18995 Avenue 232
- 267 N Strathmore Ave
- 915 S Strathmore Ave Unit I
- 1068 E Waddell St
- 23124 Round Valley Dr
- 707 N Bellah Ave
- 717 N Bellah Ave
- 452 E Tulare Rd
- 727 N Bellah Ave
- 491 N Bellah Ave
- 706 Homassel Ave
- 487 N Bellah Ave
- 472 E Tulare Rd
- 737 N Bellah Ave
- 708 N Bellah Ave
- 432 E Tulare Rd
- 720 Homassel Ave
- 477 N Bellah Ave
- 728 Homassel Ave
- 718 N Bellah Ave
- 686 Homassel Ave
- 728 N Bellah Ave
- 670 Homassel Ave
- 747 N Bellah Ave
- 738 N Bellah Ave