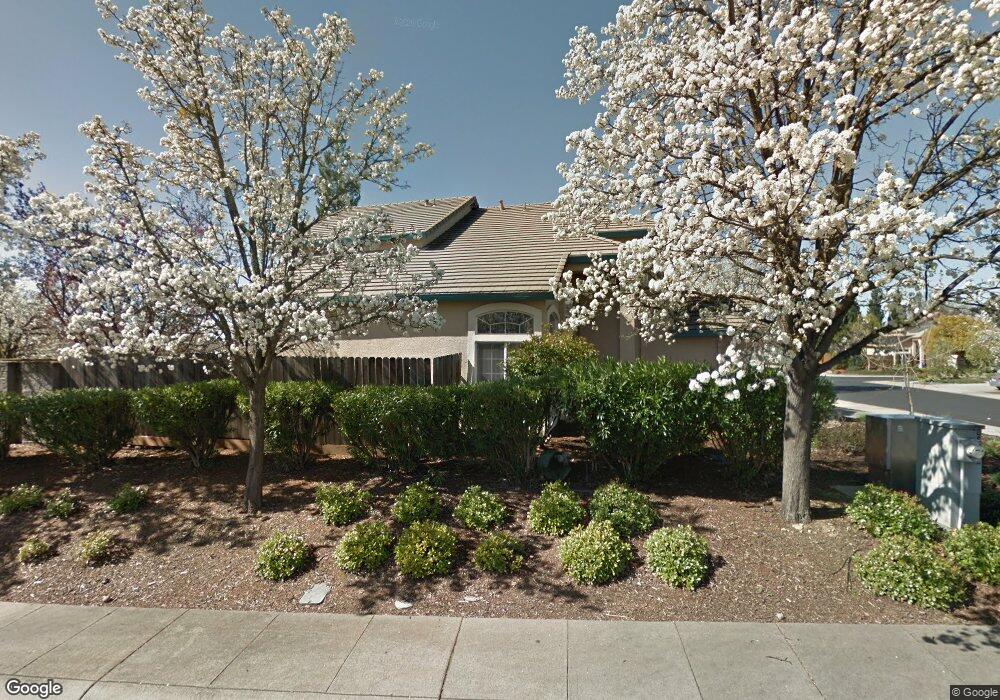
707 Sands Way Folsom, CA 95630
Estimated Value: $594,000 - $873,000
4
Beds
3
Baths
3,045
Sq Ft
$256/Sq Ft
Est. Value
About This Home
This home is located at 707 Sands Way, Folsom, CA 95630 and is currently estimated at $780,597, approximately $256 per square foot. 707 Sands Way is a home located in Sacramento County with nearby schools including Natoma Station Elementary School, Sutter Middle School, and Folsom High School.
Ownership History
Date
Name
Owned For
Owner Type
Purchase Details
Closed on
Sep 29, 2021
Sold by
Heedley Perry L
Bought by
Heedley Perry L and The Perry L Heedley Living Tru
Current Estimated Value
Purchase Details
Closed on
Jul 23, 1998
Sold by
Us Home Corp
Bought by
Heedley Perry L
Home Financials for this Owner
Home Financials are based on the most recent Mortgage that was taken out on this home.
Original Mortgage
$190,750
Outstanding Balance
$38,866
Interest Rate
6.95%
Estimated Equity
$741,731
Create a Home Valuation Report for This Property
The Home Valuation Report is an in-depth analysis detailing your home's value as well as a comparison with similar homes in the area
Home Values in the Area
Average Home Value in this Area
Purchase History
| Date | Buyer | Sale Price | Title Company |
|---|---|---|---|
| Heedley Perry L | -- | None Available | |
| Heedley Perry L | -- | None Available | |
| Heedley Perry L | $254,500 | Stewart Title |
Source: Public Records
Mortgage History
| Date | Status | Borrower | Loan Amount |
|---|---|---|---|
| Open | Heedley Perry L | $190,750 | |
| Closed | Heedley Perry L | $38,150 |
Source: Public Records
Tax History Compared to Growth
Tax History
| Year | Tax Paid | Tax Assessment Tax Assessment Total Assessment is a certain percentage of the fair market value that is determined by local assessors to be the total taxable value of land and additions on the property. | Land | Improvement |
|---|---|---|---|---|
| 2025 | $4,260 | $398,779 | $78,374 | $320,405 |
| 2024 | $4,260 | $390,961 | $76,838 | $314,123 |
| 2023 | $4,184 | $383,296 | $75,332 | $307,964 |
| 2022 | $4,123 | $375,781 | $73,855 | $301,926 |
| 2021 | $4,069 | $368,413 | $72,407 | $296,006 |
| 2020 | $4,018 | $364,636 | $71,665 | $292,971 |
| 2019 | $3,952 | $357,487 | $70,260 | $287,227 |
| 2018 | $3,854 | $350,479 | $68,883 | $281,596 |
| 2017 | $4,765 | $343,608 | $67,533 | $276,075 |
| 2016 | $4,938 | $336,871 | $66,209 | $270,662 |
| 2015 | $4,821 | $331,812 | $65,215 | $266,597 |
| 2014 | $4,644 | $325,313 | $63,938 | $261,375 |
Source: Public Records
Map
Nearby Homes
- 718 Hunter Place
- 170 Vierra Cir
- 692 Humbert St
- 664 Cole Ct
- 121 Chesterfield Way
- 705 Diamond Glen Cir
- 920 Carter St
- 865 Hagen Ct
- 467 Jewel Stone Way
- 145 Hopfield Dr
- 0 Figueroa St Unit 225034113
- 106 McNamee Dr
- 380 Gardner Ct
- 110 Lembi Dr
- 104 Hesser Ct
- 102 Black Gold Ln
- 968 Nichols Cir
- 103 Black Gold Ln
- 100 Black Gold Ln
- 190 Oxburough Dr