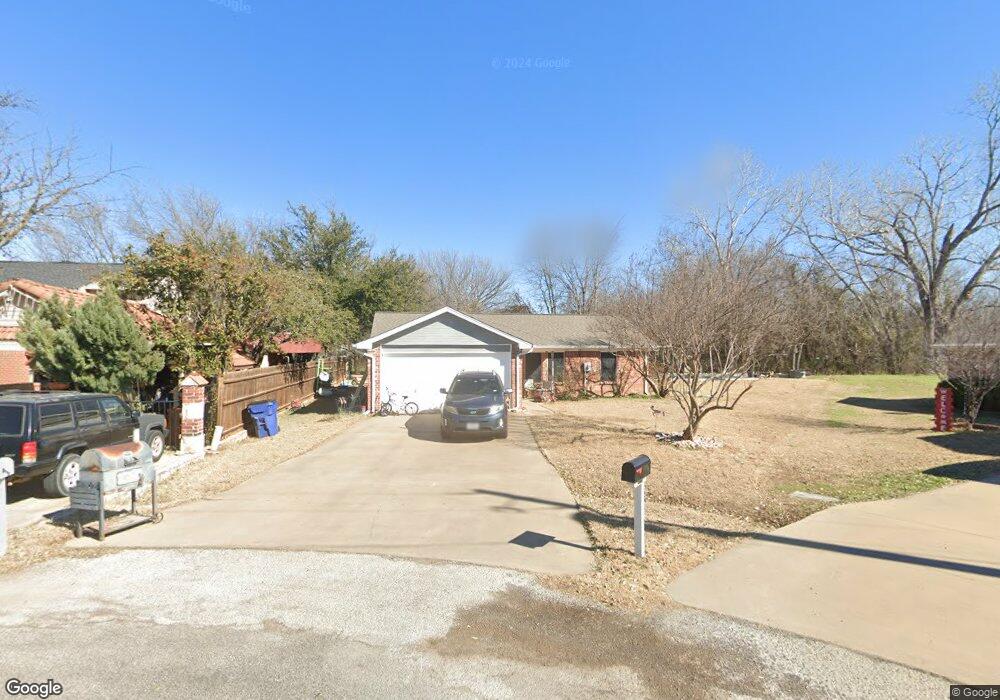
707 Shady Grove Ct Granbury, TX 76049
Estimated Value: $232,024 - $269,000
2
Beds
2
Baths
1,177
Sq Ft
$210/Sq Ft
Est. Value
About This Home
This home is located at 707 Shady Grove Ct, Granbury, TX 76049 and is currently estimated at $246,756, approximately $209 per square foot. 707 Shady Grove Ct is a home located in Hood County with nearby schools including Oak Woods School, Acton Middle School, and Granbury High School.
Ownership History
Date
Name
Owned For
Owner Type
Purchase Details
Closed on
Nov 23, 2009
Sold by
Cryaky Llc
Bought by
Dedawson Joe and Dawson Ashleigh Rae
Current Estimated Value
Home Financials for this Owner
Home Financials are based on the most recent Mortgage that was taken out on this home.
Original Mortgage
$88,775
Outstanding Balance
$57,937
Interest Rate
4.99%
Mortgage Type
New Conventional
Estimated Equity
$188,819
Purchase Details
Closed on
Feb 29, 2008
Sold by
Hughitt Rob and Hughitt Rob Roy
Bought by
Crykay Llc
Home Financials for this Owner
Home Financials are based on the most recent Mortgage that was taken out on this home.
Original Mortgage
$65,500
Interest Rate
5.68%
Mortgage Type
Purchase Money Mortgage
Purchase Details
Closed on
Oct 11, 2001
Sold by
Laguna Tres Inc
Bought by
De Dawson Joe De
Purchase Details
Closed on
Oct 22, 1993
Sold by
T & M Builders Inc
Bought by
De Dawson Joe De
Purchase Details
Closed on
May 28, 1985
Bought by
De Dawson Joe De
Create a Home Valuation Report for This Property
The Home Valuation Report is an in-depth analysis detailing your home's value as well as a comparison with similar homes in the area
Home Values in the Area
Average Home Value in this Area
Purchase History
| Date | Buyer | Sale Price | Title Company |
|---|---|---|---|
| Dedawson Joe | -- | None Available | |
| Crykay Llc | -- | None Available | |
| De Dawson Joe De | -- | -- | |
| De Dawson Joe De | -- | -- | |
| De Dawson Joe De | -- | -- |
Source: Public Records
Mortgage History
| Date | Status | Borrower | Loan Amount |
|---|---|---|---|
| Open | Dedawson Joe | $88,775 | |
| Previous Owner | Crykay Llc | $65,500 |
Source: Public Records
Tax History Compared to Growth
Tax History
| Year | Tax Paid | Tax Assessment Tax Assessment Total Assessment is a certain percentage of the fair market value that is determined by local assessors to be the total taxable value of land and additions on the property. | Land | Improvement |
|---|---|---|---|---|
| 2025 | $1,281 | $191,966 | $30,000 | $172,340 |
| 2024 | $1,146 | $174,515 | $30,000 | $193,400 |
| 2023 | $995 | $196,470 | $30,000 | $166,470 |
| 2022 | $2,130 | $160,030 | $20,000 | $140,030 |
| 2021 | $2,013 | $131,120 | $10,000 | $121,120 |
| 2020 | $2,091 | $134,640 | $10,000 | $124,640 |
| 2019 | $2,154 | $132,510 | $10,000 | $122,510 |
| 2018 | $1,808 | $111,220 | $10,000 | $101,220 |
| 2017 | $1,667 | $99,660 | $10,000 | $89,660 |
| 2016 | $1,530 | $91,510 | $10,000 | $81,510 |
| 2015 | $1,548 | $89,440 | $10,000 | $79,440 |
| 2014 | $1,548 | $93,410 | $10,000 | $83,410 |
Source: Public Records
Map
Nearby Homes
- 704 Shady Grove Ct
- 3224 W Weems Ct
- 502 Shady Grove Dr
- 2231 Cobblestone Ct
- 210 Davis Rd
- 157 Business Blvd
- Residence 3 Plan at The Residences at Cardinal Woods
- Residence 5 Plan at The Residences at Cardinal Woods
- Residence 4 Plan at The Residences at Cardinal Woods
- Residence 1 Plan at The Residences at Cardinal Woods
- Residence 2 Plan at The Residences at Cardinal Woods
- 3617 Fm-4 Tbd
- 615 Whisperview Cir
- 2009 Rock Dr
- 805 Branding Iron Trail
- 809 Branding Iron Trail
- 811 Branding Iron Trail
- 807 Branding Iron Trail
- 2902 Davis Rd
- 1931 Hidden Valley Rd
- 709 Shady Grove Ct
- 705 Shady Grove Ct
- 710 Shady Grove Ct
- 703 Shady Grove Ct
- 706 Shady Grove Ct
- 701 Shady Grove Ct
- 3107 Shady Ridge Ct
- 703 Shady Grove Dr
- 3109 Shady Grove Cir
- 609 Shady Grove Dr
- 3107 Shady Grove Cir
- 700 Shady Grove Dr
- 3119 Shady Grove Cir
- 3209 W Weems Ct
- 3105 Shady Grove Cir
- 607 Shady Grove Dr
- 3110 Shady Grove Cir
- 608 Shady Grove Dr
- 702 Shady Grove Dr
- 3102 Shady Ridge Ct