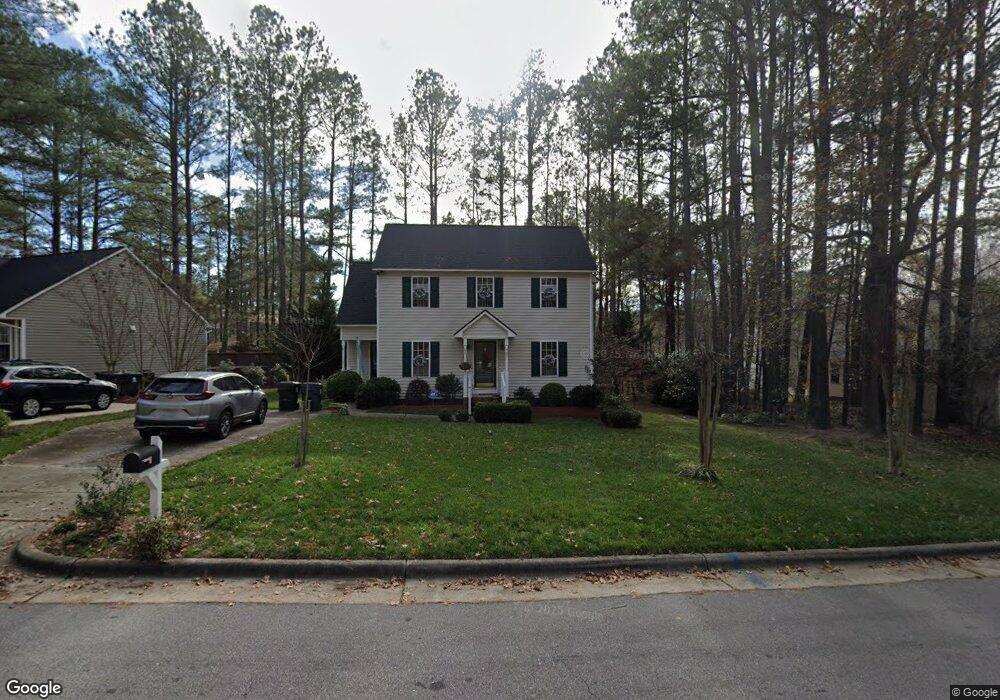
707 Southampton Dr Knightdale, NC 27545
Estimated Value: $305,000 - $337,000
3
Beds
3
Baths
1,449
Sq Ft
$226/Sq Ft
Est. Value
About This Home
This home is located at 707 Southampton Dr, Knightdale, NC 27545 and is currently estimated at $327,037, approximately $225 per square foot. 707 Southampton Dr is a home located in Wake County with nearby schools including Knightdale Elementary School, Neuse River Middle School, and Knightdale High.
Ownership History
Date
Name
Owned For
Owner Type
Purchase Details
Closed on
Nov 18, 2016
Sold by
Fox Mothy J and Fox Katslaryna Y
Bought by
Schroeder Andrew
Current Estimated Value
Home Financials for this Owner
Home Financials are based on the most recent Mortgage that was taken out on this home.
Original Mortgage
$184,103
Outstanding Balance
$147,005
Interest Rate
3.25%
Mortgage Type
FHA
Estimated Equity
$180,032
Purchase Details
Closed on
Apr 22, 2008
Sold by
Williams Yvonne D
Bought by
Fox Timothy J and Fox Katsiaryna Y
Home Financials for this Owner
Home Financials are based on the most recent Mortgage that was taken out on this home.
Original Mortgage
$149,900
Interest Rate
6.08%
Mortgage Type
Purchase Money Mortgage
Purchase Details
Closed on
Nov 28, 2001
Sold by
Spectrum Homes Inc
Bought by
Williams Yvonne D
Home Financials for this Owner
Home Financials are based on the most recent Mortgage that was taken out on this home.
Original Mortgage
$126,824
Interest Rate
6.59%
Mortgage Type
FHA
Create a Home Valuation Report for This Property
The Home Valuation Report is an in-depth analysis detailing your home's value as well as a comparison with similar homes in the area
Home Values in the Area
Average Home Value in this Area
Purchase History
| Date | Buyer | Sale Price | Title Company |
|---|---|---|---|
| Schroeder Andrew | $187,500 | None Available | |
| Fox Timothy J | $150,000 | Sterling Title Company | |
| Williams Yvonne D | $129,500 | -- |
Source: Public Records
Mortgage History
| Date | Status | Borrower | Loan Amount |
|---|---|---|---|
| Open | Schroeder Andrew | $184,103 | |
| Previous Owner | Fox Timothy J | $149,900 | |
| Previous Owner | Williams Yvonne D | $126,824 |
Source: Public Records
Tax History Compared to Growth
Tax History
| Year | Tax Paid | Tax Assessment Tax Assessment Total Assessment is a certain percentage of the fair market value that is determined by local assessors to be the total taxable value of land and additions on the property. | Land | Improvement |
|---|---|---|---|---|
| 2025 | $2,965 | $307,740 | $85,000 | $222,740 |
| 2024 | $2,954 | $307,740 | $85,000 | $222,740 |
| 2023 | $2,078 | $185,929 | $38,000 | $147,929 |
| 2022 | $2,009 | $185,929 | $38,000 | $147,929 |
| 2021 | $1,916 | $185,929 | $38,000 | $147,929 |
| 2020 | $1,916 | $185,929 | $38,000 | $147,929 |
| 2019 | $1,694 | $145,469 | $38,000 | $107,469 |
| 2018 | $1,597 | $145,469 | $38,000 | $107,469 |
| 2017 | $1,540 | $145,469 | $38,000 | $107,469 |
| 2016 | $1,519 | $145,469 | $38,000 | $107,469 |
| 2015 | $1,539 | $145,471 | $37,000 | $108,471 |
| 2014 | $1,486 | $145,471 | $37,000 | $108,471 |
Source: Public Records
Map
Nearby Homes
- 104 Saint Johns St
- 216 Walbury Dr
- 413 Laurens Way
- 302 Brakeman St
- 619 Laurens Way
- 117 Stanway Dr
- 506 Sternwheel Way
- 102 Switchback St
- 1442 Jay Rd
- 1452 Jay Rd
- 1500 Wader Cir
- 1456 Jay Rd
- 1516 Wader Cir
- 1463 Jay Rd
- 1448 Jay Rd
- 1700 Goldfinch Perch Ln
- 1580 Goldfinch Perch Ln
- 444 Haywood Glen Dr
- 1512 Wader Cir
- 1466 Jay Rd
- 705 Southampton Dr
- 101 Saint Johns St
- 103 Saint Johns St
- 103 St Johns St
- 706 Southampton Dr
- 801 Southampton Dr
- 102 Saint Johns St
- 2002 Gallows Way
- 704 Southampton Dr
- 803 Southampton Dr
- 2004 Gallows Way
- 104 St Johns St
- 702 Southampton Dr
- 2006 Gallows Way
- 604 Southampton Dr
- 2008 Gallows Way
- 107 St Johns St
- 107 Saint Johns St
- 805 Southampton Dr
- 2010 Gallows Way