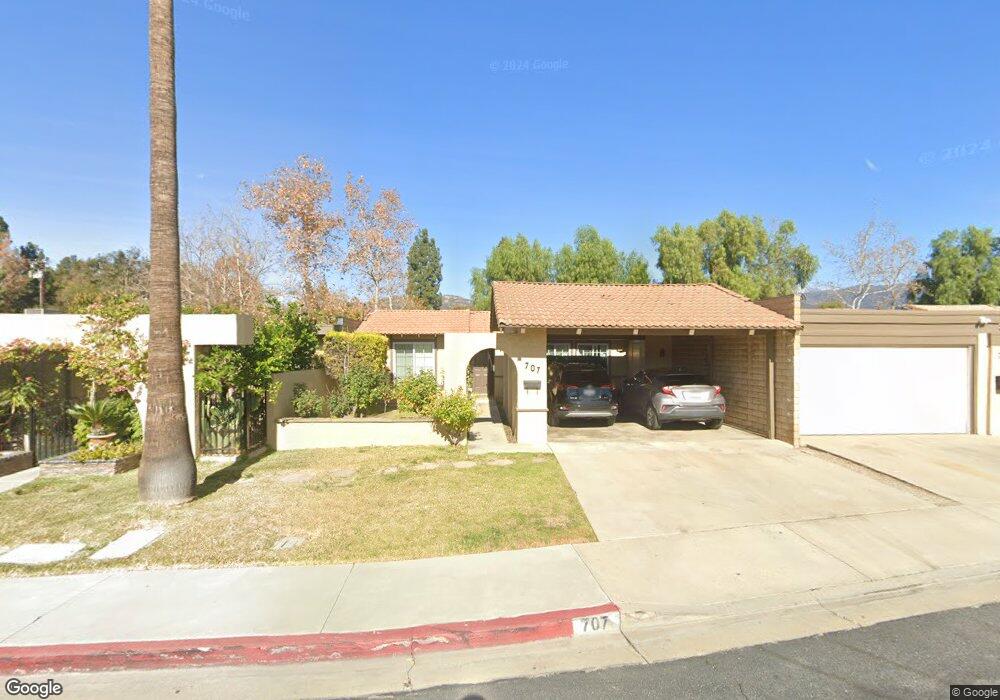
707 Via Los Santos San Dimas, CA 91773
Estimated Value: $564,000 - $648,000
3
Beds
2
Baths
1,323
Sq Ft
$471/Sq Ft
Est. Value
About This Home
This home is located at 707 Via Los Santos, San Dimas, CA 91773 and is currently estimated at $622,754, approximately $470 per square foot. 707 Via Los Santos is a home located in Los Angeles County with nearby schools including Grace Miller Elementary School, Lone Hill Middle School, and San Dimas High School.
Ownership History
Date
Name
Owned For
Owner Type
Purchase Details
Closed on
Oct 18, 2002
Sold by
Fenning Jerome M and Hollander Viki S
Bought by
Kasfy Salma M
Current Estimated Value
Home Financials for this Owner
Home Financials are based on the most recent Mortgage that was taken out on this home.
Original Mortgage
$149,600
Outstanding Balance
$62,397
Interest Rate
6.09%
Estimated Equity
$560,357
Purchase Details
Closed on
Sep 21, 2002
Sold by
Kasfy Ali
Bought by
Kasfy Salma M
Home Financials for this Owner
Home Financials are based on the most recent Mortgage that was taken out on this home.
Original Mortgage
$149,600
Outstanding Balance
$62,397
Interest Rate
6.09%
Estimated Equity
$560,357
Purchase Details
Closed on
Feb 7, 1994
Sold by
Fenning Jerome M
Bought by
Fenning Jerome M and Hollander Viki S
Home Financials for this Owner
Home Financials are based on the most recent Mortgage that was taken out on this home.
Original Mortgage
$81,000
Interest Rate
7.1%
Create a Home Valuation Report for This Property
The Home Valuation Report is an in-depth analysis detailing your home's value as well as a comparison with similar homes in the area
Home Values in the Area
Average Home Value in this Area
Purchase History
| Date | Buyer | Sale Price | Title Company |
|---|---|---|---|
| Kasfy Salma M | $187,000 | Chicago Title | |
| Kasfy Salma M | -- | Chicago Title | |
| Fenning Jerome M | -- | Provident Title |
Source: Public Records
Mortgage History
| Date | Status | Borrower | Loan Amount |
|---|---|---|---|
| Open | Kasfy Salma M | $149,600 | |
| Previous Owner | Fenning Jerome M | $81,000 | |
| Closed | Kasfy Salma M | $18,700 |
Source: Public Records
Tax History Compared to Growth
Tax History
| Year | Tax Paid | Tax Assessment Tax Assessment Total Assessment is a certain percentage of the fair market value that is determined by local assessors to be the total taxable value of land and additions on the property. | Land | Improvement |
|---|---|---|---|---|
| 2025 | $3,471 | $270,814 | $183,925 | $86,889 |
| 2024 | $3,471 | $265,505 | $180,319 | $85,186 |
| 2023 | $3,393 | $260,300 | $176,784 | $83,516 |
| 2022 | $3,333 | $255,197 | $173,318 | $81,879 |
| 2021 | $3,261 | $250,194 | $169,920 | $80,274 |
| 2019 | $3,192 | $242,775 | $164,881 | $77,894 |
| 2018 | $3,023 | $238,016 | $161,649 | $76,367 |
| 2016 | $2,901 | $228,775 | $155,373 | $73,402 |
| 2015 | $2,855 | $225,340 | $153,040 | $72,300 |
| 2014 | $2,832 | $220,927 | $150,043 | $70,884 |
Source: Public Records
Map
Nearby Homes
- 208 S Gaffney Ave
- 840 Bonita Ave
- 2206 Stratford Way
- 808 Arbor Cir
- 518 Willow Place
- 1301 3rd St
- 1770 Van Dusen Rd
- 624 E Payson St
- 2729 Sedalia Ave
- 610 E Payson St
- 402 E De Anza Heights Dr
- 727 Glenlea St
- 748 S Walnut Ave
- 612 N Oceanbluff Ave
- 751 Harwood Ct
- 208 E 3rd St
- 429 E Gladstone St
- 785 Teakwood Ln
- 1117 Gladstone St
- 740 N Delancey Ave
- 709 Via Los Santos
- 703 Via Los Santos
- 701 Via Los Santos
- 711 Via Los Santos
- 713 Via Los Santos
- 234 S San Dimas Canyon Rd
- 708 Via Los Santos
- 710 Via Los Santos
- 712 Via Los Santos
- 240 S San Dimas Canyon Rd
- 714 Via Los Santos
- 717 Via Los Santos
- 244 S San Dimas Canyon Rd
- 721 Via Los Santos
- 718 Via Los Santos
- 300 S San Dimas Canyon Rd
- 720 Via Los Santos
- 225 S San Dimas Canyon Rd Unit 11
- 225 S San Dimas Canyon Rd Unit 8
- 225 S San Dimas Canyon Rd Unit 10