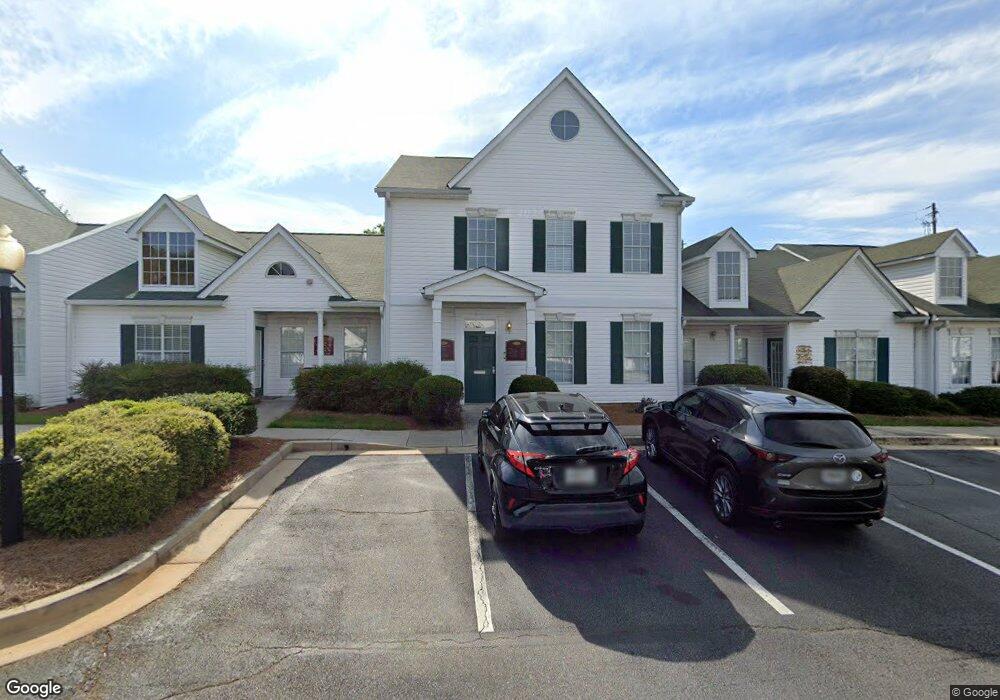
707 Whitlock Ave SW Unit A40 Marietta, GA 30064
Southwestern Marietta NeighborhoodEstimated Value: $576,096
--
Bed
--
Bath
2,632
Sq Ft
$219/Sq Ft
Est. Value
About This Home
This home is located at 707 Whitlock Ave SW Unit A40, Marietta, GA 30064 and is currently estimated at $576,096, approximately $218 per square foot. 707 Whitlock Ave SW Unit A40 is a home located in Cobb County with nearby schools including A.L. Burruss Elementary School, Marietta Sixth Grade Academy, and Marietta Middle School.
Ownership History
Date
Name
Owned For
Owner Type
Purchase Details
Closed on
Oct 24, 2023
Sold by
Hmem Holdings Llc
Bought by
Selected Holdings Llc
Current Estimated Value
Home Financials for this Owner
Home Financials are based on the most recent Mortgage that was taken out on this home.
Original Mortgage
$432,000
Outstanding Balance
$166,799
Interest Rate
7.18%
Mortgage Type
Seller Take Back
Estimated Equity
$409,297
Purchase Details
Closed on
May 7, 2018
Sold by
Palmer House Llc
Bought by
Hmem Holdings Llc
Home Financials for this Owner
Home Financials are based on the most recent Mortgage that was taken out on this home.
Original Mortgage
$215,000
Interest Rate
4.4%
Mortgage Type
New Conventional
Purchase Details
Closed on
Dec 14, 2012
Sold by
Agility Holdings Llc
Bought by
Palmer House Llc
Home Financials for this Owner
Home Financials are based on the most recent Mortgage that was taken out on this home.
Original Mortgage
$112,500
Interest Rate
3.38%
Mortgage Type
New Conventional
Create a Home Valuation Report for This Property
The Home Valuation Report is an in-depth analysis detailing your home's value as well as a comparison with similar homes in the area
Home Values in the Area
Average Home Value in this Area
Purchase History
| Date | Buyer | Sale Price | Title Company |
|---|---|---|---|
| Selected Holdings Llc | $540,000 | None Listed On Document | |
| Hmem Holdings Llc | $240,000 | -- | |
| Palmer House Llc | $153,946 | -- |
Source: Public Records
Mortgage History
| Date | Status | Borrower | Loan Amount |
|---|---|---|---|
| Open | Selected Holdings Llc | $432,000 | |
| Previous Owner | Hmem Holdings Llc | $215,000 | |
| Previous Owner | Palmer House Llc | $112,500 |
Source: Public Records
Tax History Compared to Growth
Tax History
| Year | Tax Paid | Tax Assessment Tax Assessment Total Assessment is a certain percentage of the fair market value that is determined by local assessors to be the total taxable value of land and additions on the property. | Land | Improvement |
|---|---|---|---|---|
| 2025 | $1,425 | $168,440 | $47,220 | $121,220 |
| 2024 | $1,249 | $147,580 | $28,332 | $119,248 |
| 2023 | $1,086 | $128,340 | $24,636 | $103,704 |
| 2022 | $1,025 | $121,192 | $20,468 | $100,724 |
| 2021 | $1,039 | $120,972 | $20,468 | $100,504 |
| 2020 | $1,039 | $120,972 | $20,468 | $100,504 |
| 2019 | $825 | $96,000 | $18,400 | $77,600 |
| 2018 | $883 | $102,768 | $20,468 | $82,300 |
| 2017 | $708 | $102,768 | $20,468 | $82,300 |
| 2016 | $657 | $95,404 | $18,952 | $76,452 |
| 2015 | $716 | $95,404 | $18,952 | $76,452 |
| 2014 | $477 | $61,572 | $12,652 | $48,920 |
Source: Public Records
Map
Nearby Homes
- 80 Lindley Ave NW Unit 1
- 920 Wemberley Ln
- 260 Manning Rd SW Unit 110
- 909 Wemberley Ln
- 984 Wemberley Ln
- 917 Wemberley Ln
- 204 Wakehurst Way
- 002 Wakehurst Way
- The Vinings Plan at The Cottages at Keeler Woods
- 201 Wakehurst Way
- The Weston Plan at The Cottages at Keeler Woods
- 740 Polk St NW
- 746 Polk St NW
- 290 Westland Way SW
- 798 Sentinel Ridge SW
- 563 Hillandale Cir SW
- 873 Cavalry Dr SW
- 838 Cannon Run SW
- 199 Brookwood Dr SW
- 834 Cannon Run SW
- 707 Whitlock Ave SW Unit 12H
- 707 Whitlock Ave SW
- 707 Whitlock Ave SW Unit A38/39
- 707 Whitlock Ave SW Unit A-36
- 707 Whitlock Ave SW Unit E15
- 707 Whitlock Ave SW Unit H12
- 707 Whitlock Ave SW Unit G-6
- 707 Whitlock Ave SW Unit K-47
- 707 Whitlock Ave SW Unit J-45
- 707 Whitlock Ave SW Unit 707
- 707 Whitlock Ave SW Unit J-43
- 707 Whitlock Ave SW Unit C28
- 707 Whitlock Ave SW Unit F1
- 707 Whitlock Ave SW Unit B-21
- 707 Whitlock Ave SW Unit D-33
- 707 Whitlock Ave SW Unit G5
- 707 Whitlock Ave SW Unit F2
- 707 Whitlock Ave SW Unit K46
- 707 Whitlock Ave SW Unit STE F1
- 707 Whitlock Ave SW