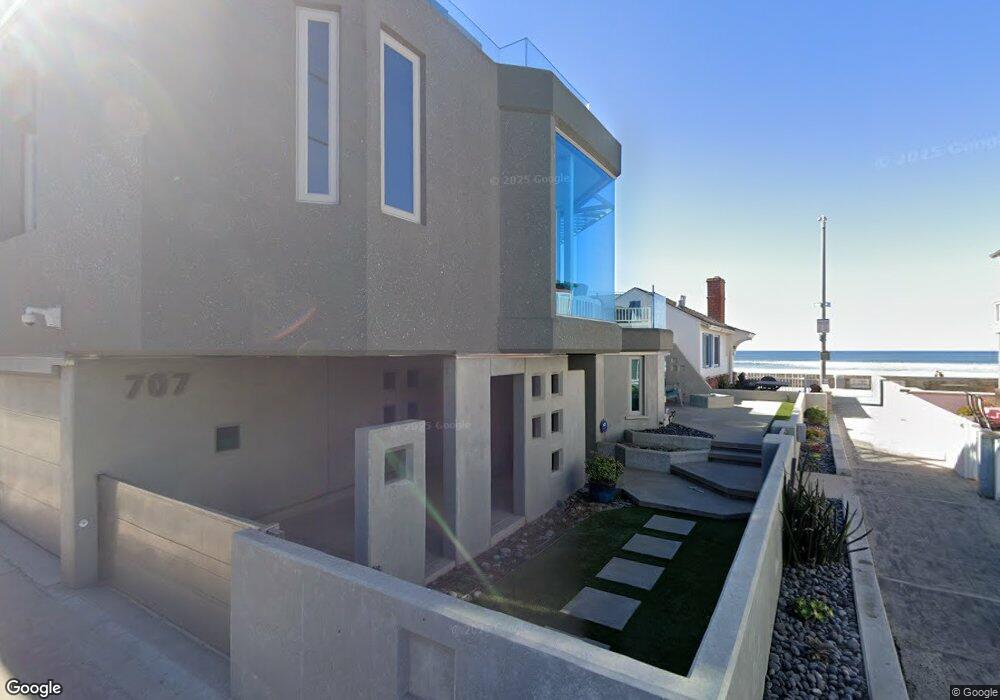
707 Windemere Ct San Diego, CA 92109
Mission Beach NeighborhoodEstimated Value: $2,478,000 - $3,853,000
3
Beds
4
Baths
2,806
Sq Ft
$1,102/Sq Ft
Est. Value
About This Home
This home is located at 707 Windemere Ct, San Diego, CA 92109 and is currently estimated at $3,092,794, approximately $1,102 per square foot. 707 Windemere Ct is a home located in San Diego County with nearby schools including Pacific Beach Elementary School, Pacific Beach Middle, and Mission Bay High School.
Ownership History
Date
Name
Owned For
Owner Type
Purchase Details
Closed on
Oct 21, 2002
Sold by
Edelstein Hans Peter and Edelstein Melanie J
Bought by
H P E Properties Llc
Current Estimated Value
Purchase Details
Closed on
Jul 26, 2000
Sold by
Trask Marilyn Louise
Bought by
The Marilyn Louise Trask Living Trust
Purchase Details
Closed on
Dec 9, 1999
Sold by
Trask Webster & Helen Family Trust A and Webster E
Bought by
Trask Webster Elliott and Trask Marilyn Louise
Purchase Details
Closed on
Jun 17, 1999
Sold by
Trask Webster & Helen Family Trust A and Webster E
Bought by
Trask Webster Elliott and Trask Marilyn Louise
Purchase Details
Closed on
Mar 6, 1996
Sold by
Trask Webster & Helen Family Trust
Bought by
Trask Helen M
Create a Home Valuation Report for This Property
The Home Valuation Report is an in-depth analysis detailing your home's value as well as a comparison with similar homes in the area
Home Values in the Area
Average Home Value in this Area
Purchase History
| Date | Buyer | Sale Price | Title Company |
|---|---|---|---|
| H P E Properties Llc | -- | -- | |
| The Marilyn Louise Trask Living Trust | -- | -- | |
| Trask Webster Elliott | -- | -- | |
| Trask Webster Elliott | -- | -- | |
| Trask Helen M | -- | -- | |
| Trask Helen M | -- | -- |
Source: Public Records
Tax History Compared to Growth
Tax History
| Year | Tax Paid | Tax Assessment Tax Assessment Total Assessment is a certain percentage of the fair market value that is determined by local assessors to be the total taxable value of land and additions on the property. | Land | Improvement |
|---|---|---|---|---|
| 2025 | $33,909 | $2,812,133 | $1,821,690 | $990,443 |
| 2024 | $33,909 | $2,756,994 | $1,785,971 | $971,023 |
| 2023 | $33,162 | $2,702,936 | $1,750,952 | $951,984 |
| 2022 | $32,280 | $2,649,938 | $1,716,620 | $933,318 |
| 2021 | $32,058 | $2,597,979 | $1,682,961 | $915,018 |
| 2020 | $31,667 | $2,571,341 | $1,665,705 | $905,636 |
| 2019 | $31,102 | $2,520,924 | $1,633,045 | $887,879 |
| 2018 | $29,074 | $2,471,495 | $1,601,025 | $870,470 |
| 2017 | $28,393 | $2,423,035 | $1,569,633 | $853,402 |
| 2016 | $27,945 | $2,375,525 | $1,538,856 | $836,669 |
| 2015 | $27,533 | $2,339,843 | $1,515,741 | $824,102 |
| 2014 | $27,092 | $2,294,009 | $1,486,050 | $807,959 |
Source: Public Records
Map
Nearby Homes
- 737 Whiting Ct
- 710 Verona Ct
- 749 York Ct
- 714 York Ct
- 3921 Ocean Front Walk
- 701 Sunset Ct
- 4111 Bayard St
- 722 San Jose Place
- 713 San Jose Place
- 806 Redondo Ct
- 3755 Ocean Front Walk Unit 18
- 841 Pismo Ct
- 821 Portsmouth Ct Unit E
- 876 Thomas Ave
- 866 Grand Ave
- 727 Ostend Ct
- 1152-54 Pacific Beach Dr
- 4465 Ocean Blvd Unit 1
- 1221 Parker Place Unit 15
- 4475 Mission Blvd Unit 1
- 703 Windemere Ct
- 715 Windemere Ct
- 702 & 708 Whiting Ct
- 710 Windemere Ct
- 706 Windemere Ct
- 708 Whiting Ct
- 710 Whiting Ct
- 702 Whiting Ct
- 3949 Ocean Front Walk Unit 53
- 721 Windemere Ct
- 716 Windemere Ct
- 714 Whiting Ct
- 714 Whiting Ct
- 720 Windemere Ct
- 716 Whiting Ct
- 723 Windemere Ct
- 724 Windemere Ct
- 709 Whiting Ct
- 707 Whiting Ct
- 3936 Strandway