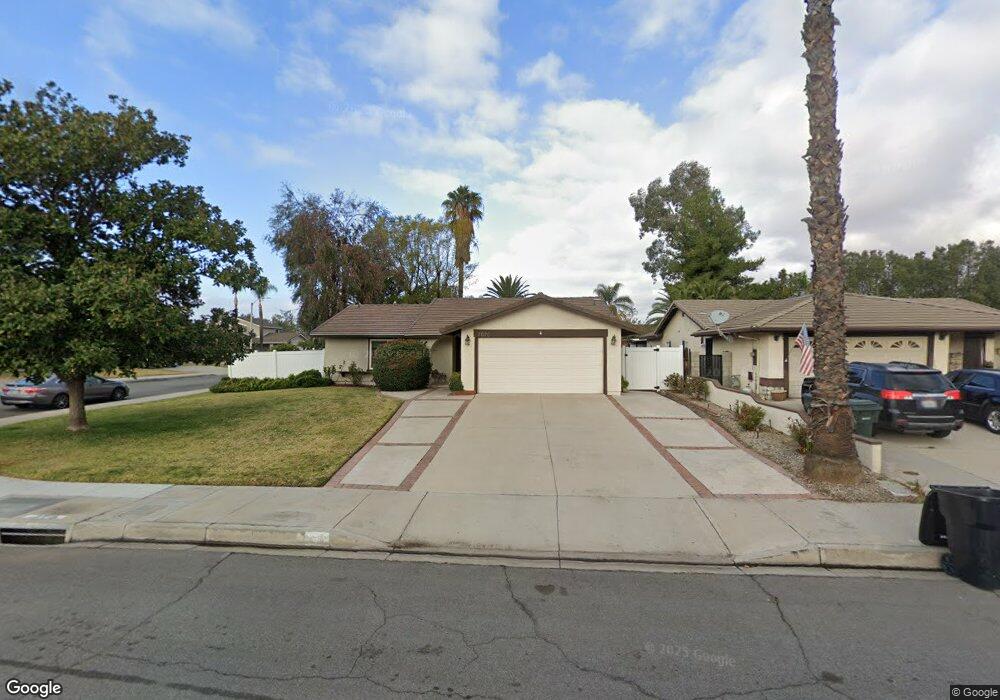
7070 Grove Ave Highland, CA 92346
East Highlands NeighborhoodEstimated Value: $545,350 - $571,000
3
Beds
2
Baths
1,505
Sq Ft
$373/Sq Ft
Est. Value
About This Home
This home is located at 7070 Grove Ave, Highland, CA 92346 and is currently estimated at $561,838, approximately $373 per square foot. 7070 Grove Ave is a home located in San Bernardino County with nearby schools including Thompson Elementary School, Serrano Middle School, and San Gorgonio High School.
Ownership History
Date
Name
Owned For
Owner Type
Purchase Details
Closed on
Sep 27, 2023
Sold by
Haag John M and Haag Vici C
Bought by
John M Haag And Vici C Haag Revocable Trust and Haag
Current Estimated Value
Purchase Details
Closed on
Feb 22, 1999
Sold by
Principal Residential Mtg Inc
Bought by
Watson Vici
Home Financials for this Owner
Home Financials are based on the most recent Mortgage that was taken out on this home.
Original Mortgage
$129,136
Interest Rate
6.78%
Mortgage Type
FHA
Purchase Details
Closed on
Aug 4, 1998
Sold by
Roberts George P and Roberts Sherri M
Bought by
Principal Residential Mtg Inc
Purchase Details
Closed on
May 31, 1994
Sold by
Gantes Patricia C
Bought by
Roberts George P and Roberts Sherri M
Home Financials for this Owner
Home Financials are based on the most recent Mortgage that was taken out on this home.
Original Mortgage
$128,826
Interest Rate
8.57%
Mortgage Type
Assumption
Create a Home Valuation Report for This Property
The Home Valuation Report is an in-depth analysis detailing your home's value as well as a comparison with similar homes in the area
Home Values in the Area
Average Home Value in this Area
Purchase History
| Date | Buyer | Sale Price | Title Company |
|---|---|---|---|
| John M Haag And Vici C Haag Revocable Trust | -- | None Listed On Document | |
| Haag John M | -- | None Listed On Document | |
| Watson Vici | $130,000 | First American Title Ins Co | |
| Principal Residential Mtg Inc | $122,500 | North American Title Co | |
| Roberts George P | $126,500 | Fidelity National Title Ins |
Source: Public Records
Mortgage History
| Date | Status | Borrower | Loan Amount |
|---|---|---|---|
| Previous Owner | Watson Vici | $129,136 | |
| Previous Owner | Roberts George P | $128,826 |
Source: Public Records
Tax History
| Year | Tax Paid | Tax Assessment Tax Assessment Total Assessment is a certain percentage of the fair market value that is determined by local assessors to be the total taxable value of land and additions on the property. | Land | Improvement |
|---|---|---|---|---|
| 2025 | $2,910 | $203,806 | $50,952 | $152,854 |
| 2024 | $2,848 | $199,810 | $49,953 | $149,857 |
| 2023 | $2,787 | $195,893 | $48,974 | $146,919 |
| 2022 | $2,785 | $192,052 | $48,014 | $144,038 |
| 2021 | $2,747 | $188,287 | $47,073 | $141,214 |
| 2020 | $2,739 | $186,356 | $46,590 | $139,766 |
| 2019 | $2,645 | $182,701 | $45,676 | $137,025 |
| 2018 | $2,548 | $179,118 | $44,780 | $134,338 |
| 2017 | $2,225 | $175,606 | $43,902 | $131,704 |
| 2016 | $2,158 | $172,163 | $43,041 | $129,122 |
| 2015 | $2,196 | $169,576 | $42,394 | $127,182 |
| 2014 | $2,135 | $166,255 | $41,564 | $124,691 |
Source: Public Records
Map
Nearby Homes
- 6959 Grove Ave
- 28005 Nona Ave
- 28261 Cornus Ct
- 6886 Country Oaks Dr
- 0 Baseline St Unit CV25136921
- 27631 Villa Ave
- 7079 Cienega Dr
- 27611 Villa Ave
- 1614 Buckeye St
- 0 Boulder Ave Unit RS26051330
- 7001 Church Ave Unit 15
- 6632 Summertrail Place
- 27540 14th St
- 7471 Dunkirk Ave
- 6986 Church Ave
- 6984 Bradford Ave
- 28237 Kane Ct
- 7354 Harding Ct
- 6927 Gala St
- 0 La Praix St
- 7060 Grove Ave
- 28010 Stratford St
- 7052 Grove Ave
- 28023 Stratford St
- 28004 Stratford St
- 28015 Stratford St
- 7071 Grove Ave
- 28029 Stratford St
- 7025 Laurel Place
- 7044 Grove Ave
- 28007 Stratford St
- 7061 Grove Ave
- 7079 Grove Ave
- 28033 Stratford St
- 7029 Laurel Place
- 7053 Grove Ave
- 27995 Stratford St
- 7034 Grove Ave
- 7049 Laurel Place
- 7021 Laurel Place
Your Personal Tour Guide
Ask me questions while you tour the home.