7071 Lazy River Way Sacramento, CA 95831
Pocket-Greenhaven NeighborhoodEstimated Value: $631,000 - $782,000
4
Beds
3
Baths
2,517
Sq Ft
$291/Sq Ft
Est. Value
About This Home
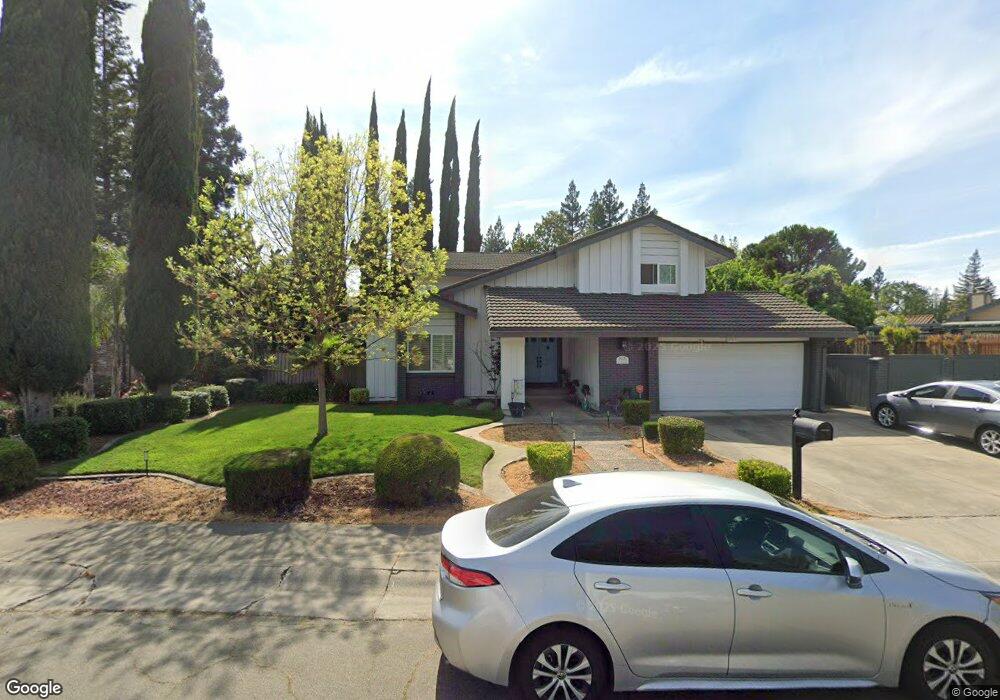
This home is located at 7071 Lazy River Way, Sacramento, CA 95831 and is currently estimated at $732,705, approximately $291 per square foot. 7071 Lazy River Way is a home located in Sacramento County with nearby schools including Genevieve Didion School, Sam Brannan Middle School, and John F. Kennedy High School.
Ownership History
Date
Name
Owned For
Owner Type
Purchase Details
Closed on
Jun 29, 2020
Sold by
Martus Leo and Martus Linda S
Bought by
Martus Leo and Martus Linda S
Current Estimated Value
Purchase Details
Closed on
Apr 15, 2004
Sold by
Chan Fong Melvin Samuel and Chan Fong Agnes
Bought by
Martus Leo and Martus Linda S
Home Financials for this Owner
Home Financials are based on the most recent Mortgage that was taken out on this home.
Original Mortgage
$333,700
Outstanding Balance
$153,632
Interest Rate
5.35%
Mortgage Type
Purchase Money Mortgage
Estimated Equity
$579,073
Purchase Details
Closed on
Aug 15, 2002
Sold by
Kyser Jamie and Kyser Jason
Bought by
Fong Melvin Samuel and Fong Agnes C
Home Financials for this Owner
Home Financials are based on the most recent Mortgage that was taken out on this home.
Original Mortgage
$217,000
Interest Rate
6.52%
Create a Home Valuation Report for This Property
The Home Valuation Report is an in-depth analysis detailing your home's value as well as a comparison with similar homes in the area
Home Values in the Area
Average Home Value in this Area
Purchase History
| Date | Buyer | Sale Price | Title Company |
|---|---|---|---|
| Martus Leo | -- | None Available | |
| Martus Leo | $428,500 | Chicago Title Co | |
| Fong Melvin Samuel | $310,000 | Chicago Title Co |
Source: Public Records
Mortgage History
| Date | Status | Borrower | Loan Amount |
|---|---|---|---|
| Open | Martus Leo | $333,700 | |
| Previous Owner | Fong Melvin Samuel | $217,000 |
Source: Public Records
Tax History Compared to Growth
Tax History
| Year | Tax Paid | Tax Assessment Tax Assessment Total Assessment is a certain percentage of the fair market value that is determined by local assessors to be the total taxable value of land and additions on the property. | Land | Improvement |
|---|---|---|---|---|
| 2025 | $7,253 | $609,220 | $142,171 | $467,049 |
| 2024 | $7,253 | $597,276 | $139,384 | $457,892 |
| 2023 | $7,075 | $585,565 | $136,651 | $448,914 |
| 2022 | $6,971 | $574,084 | $133,972 | $440,112 |
| 2021 | $6,637 | $562,829 | $131,346 | $431,483 |
| 2020 | $6,686 | $557,059 | $130,000 | $427,059 |
| 2019 | $6,544 | $546,137 | $127,451 | $418,686 |
| 2018 | $6,374 | $535,429 | $124,952 | $410,477 |
| 2017 | $6,283 | $524,931 | $122,502 | $402,429 |
| 2016 | $5,969 | $498,631 | $116,364 | $382,267 |
| 2015 | $5,541 | $461,696 | $107,745 | $353,951 |
| 2014 | $5,350 | $448,249 | $104,607 | $343,642 |
Source: Public Records
Map
Nearby Homes
- 7074 Lazy River Way
- 0 Riverside Blvd
- 5 Dumfries Ct
- 9 Sandhill Ct
- 487 Twin River Way
- 6810 Arabella Way
- 6730 Park Riviera Way
- 625 Valim Way
- 506 Roundtree Ct
- 420 Seagull Way
- 462 de Mar Dr
- 14 Westlite Ct
- 7441 Spicewood Dr
- 4 Marina Blue Ct
- 7791 Park River Oak Cir
- 7716 George River Ln
- 7455 Summerwind Way
- 4 Park River Oak Ct
- 792 Parklin Ave
- 657 Brickyard Dr
- 7077 Lazy River Way
- 7065 Lazy River Way
- 7089 Riverside Blvd
- 7070 Lazy River Way
- 7103 Riverside Blvd
- 7099 Riverside Blvd
- 7083 Riverside Blvd
- 7095 Riverside Blvd
- 7064 Lazy River Way
- 14 Black River Ct
- 7078 Lazy River Way
- 7084 Lazy River Way
- 7082 Lazy River Way
- 15 Black River Ct
- 7107 Riverside Blvd
- 7060 Lazy River Way
- 7075 Riverside Blvd
- 10 Black River Ct
- 7111 Riverside Blvd
- 7056 Lazy River Way